
NEW YORK, August 6, 2026, 05:02 EDT
- Figma shares were down 15.1% in premarket trading at $23.90.
- Revenue increased by 48%, whereas the cost of revenue surged 117%.
- The midpoint of revenue guidance increased by $40 million, while profit guidance remained the same.
Shares of Figma, Inc. NYSE:FIG dropped 15.1% to $23.90 in premarket trade on Thursday. The main New York Stock Exchange session was not open.
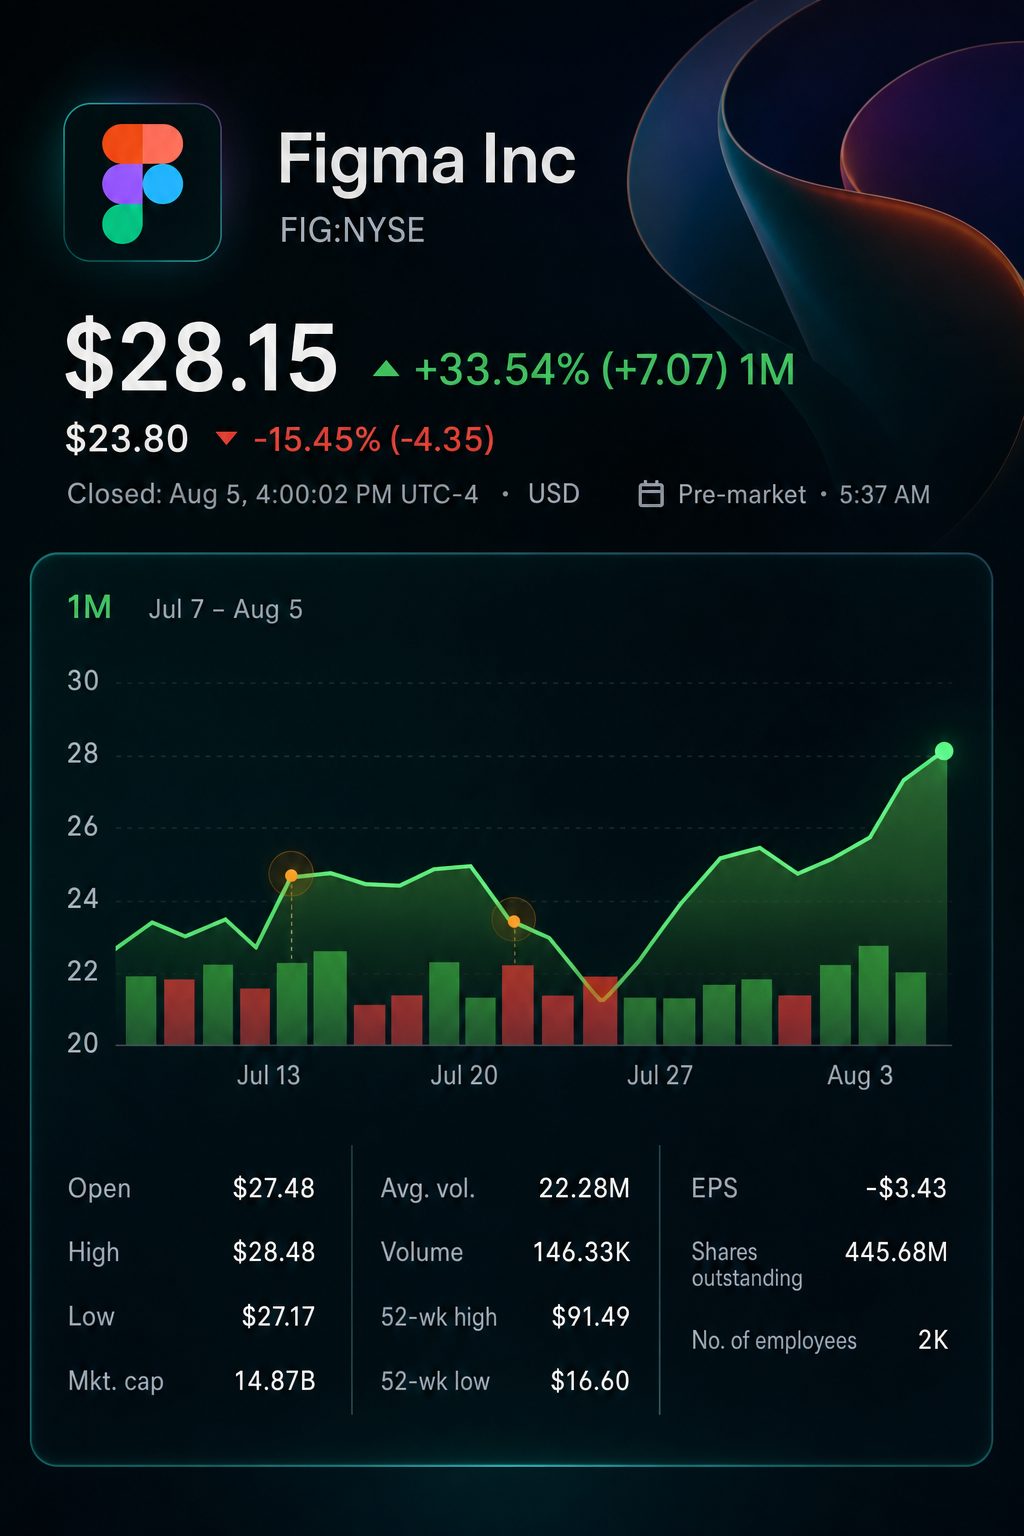
The drop came despite a strong demand performance. Revenue was $370.1 million, surpassing the LSEG forecast of $351.6 million. However, investor attention shifted to the expense trajectory.
The worry centres on a sharp discrepancy: while sales jumped 48%, cost of revenue climbed 117%. Gross profit saw a gain of just 40%.
| Second-quarter metric | 2026 | 2025 | Change |
|---|---|---|---|
| Revenue | $370.1 mln | $249.6 mln | up 48% |
| Cost of revenue | $60.5 mln | $27.9 mln | up 117% |
| Gross profit | $309.6 mln | $221.8 mln | up 40% |
| GAAP gross margin | 84% | 89% | down 5 points |
| Research and development | $167.3 mln | $83.1 mln | up 101% |
| Free-cash-flow margin | 14% | 24% | down 10 points |
The firm posted approximately 73 cents in additional gross profit for each new dollar of revenue. AI infrastructure and hosting accounted for $27.1 million out of the $32.6 million rise in costs, representing 83%.
Figma increased its midpoint revenue projection for the full year by $40 million. Non-GAAP operating income guidance remained unchanged. The resulting midpoint margin declined by roughly 25 basis points.
| Full-year 2026 outlook | Previous | New | Change |
|---|---|---|---|
| Revenue | $1.422–$1.428 bln | $1.463–$1.467 bln | Midpoint up $40 mln |
| Non-GAAP operating income | $125–$135 mln | $125–$135 mln | No change |
| Implied midpoint margin | 9.12% | 8.87% | Down 25 basis points |
The margin is calculated based on the midpoint of each company’s range. Figma adjusts the revised value to 9%. However, the core ratio continued its downward trend.
Customer indicators held firm. Net dollar retention reached 136%. Over 80% of large paying customers used AI credits on a weekly basis.
By July 31, over half of these customers were using Figma’s agent each week. Chief Financial Officer Praveer Melwani described the second quarter as the “first full quarter of AI credit monetization.” Speaking to Reuters, Melwani said Figma aimed to “create durable modes of growth over the long term.” Business Wire
Wall Street was divided ahead of the report. Of 15 ratings, nine were Holds while six were Buys.
| Analyst recommendation | Current | One month ago |
|---|---|---|
| Buy | 6 | 6 |
| Overweight | 0 | 1 |
| Hold | 9 | 8 |
| Underweight | 0 | 0 |
| Sell | 0 | 0 |
| Consensus | Overweight | Overweight |
Before the results, analysts had set an average target of $30.44, within a range of $22 to $38. With shares at $23.90, the average target indicated a potential increase of about 27%. As of the dateline, there were no widespread changes to estimates following the results.
Figma ended Wednesday at $28.15, up 18.5% over the previous five sessions. The premarket decline is set to wipe out nearly all of those gains. As of Wednesday, shares had fallen 24.7% so far this year.
The upcoming supply event occurs on Friday, when around 77.7 million previously restricted Class A shares will be available for trading. This accounts for about 39% of the reported public float. Shares becoming eligible does not ensure they will be sold.
Risks continue to be balanced on both sides. AI expenses may cause continued margin fluctuations as monetization advances. As of July 15, short interest stood at 33.16% of float, and the upcoming lock-up expiration on Friday could increase volatility.
The revenue outperformance is not in question for investors. The key issue is if AI-credit sales can surpass infrastructure and hosting expenses. Figma’s steady profit outlook signals that returns are still some way off.
Related articles: NYSE:FIG