
NEW YORK, August 5, 2026, 19:03 EDT — U.S. regular trading ended; after-hours session continued.
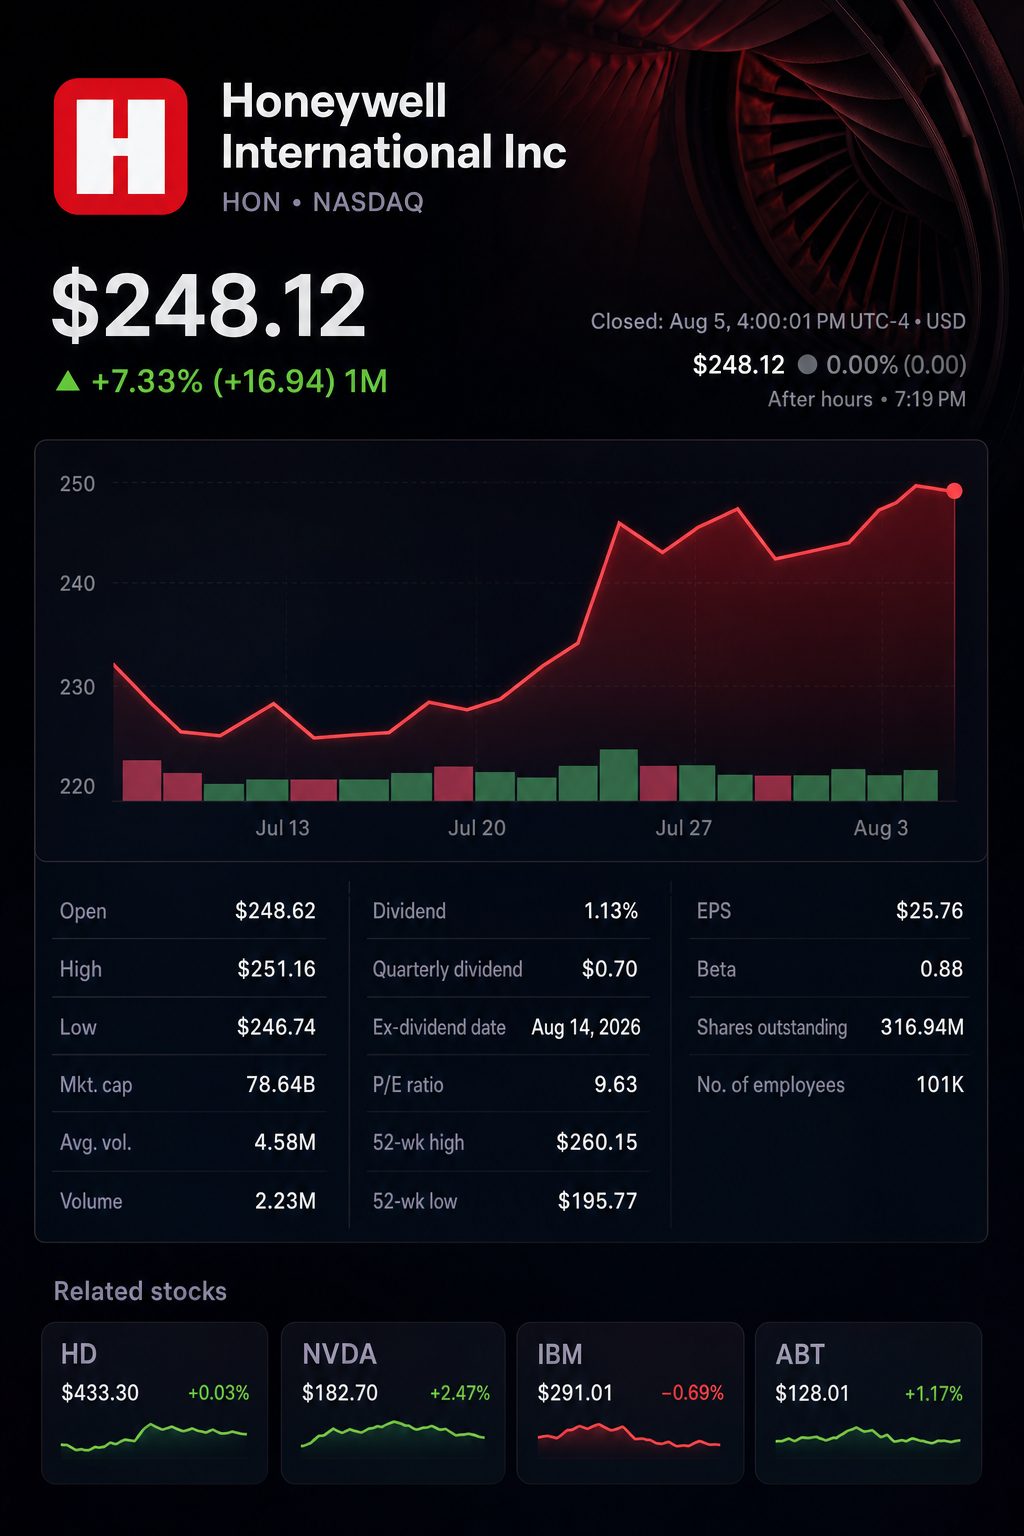
Shares of Honeywell Aerospace Inc. NASDAQ:HONA slipped 10.2% to $182.83 in after-hours trading on Wednesday. The company lowered its 2026 projection for organic growth to a range of 4%-5%. Adjusted earnings guidance was set below the $8.86 average analyst estimate provided by London Stock Exchange Group LON:LSEG.
Investors received a clear signal from the Engines and Power Systems segment, where adjusted EBIT dropped by $82 million—more than Honeywell’s total net decrease of $71 million. Based on company figures, this unit was responsible for 115% of the overall decline. Meanwhile, Control Systems offset $28 million of the loss.
Demand remained strong, with backlog increasing 9% to $18.15 billion and aftermarket sales up 8%. However, supply chain constraints shifted production toward Boeing Co. NYSE:BA, Airbus SE EPA:AIR and domestic defense contracts, which have a less favorable near-term mix. Chief Financial Officer Josh Jepsen said, “Demand continues to be really robust. It’s really a supply challenge.” Honeywell Aerospace Inc.
Trading on Wednesday set Honeywell apart from major aerospace competitors.
| Company | Regular close | Regular-session move | After-hours price | Extended move |
|---|---|---|---|---|
| Honeywell Aerospace | $203.64 | down 5.93% | $182.83 | off 10.22% |
| GE Aerospace NYSE:GE | $381.22 | up 0.98% | — | — |
| RTX Corp. NYSE:RTX | $222.31 | rose 2.02% | — | — |
Shares of GE Aerospace and RTX advanced in normal session trading. In contrast, Honeywell’s drop after the bell appears specific to the company. Differences in earnings release schedules prevent a direct real-time comparison.
The quarter fell short of Wall Street forecasts for both revenue and adjusted profit. Reported figures from the company and consensus estimates as published by the Wall Street Journal were used for the comparison.
| Second-quarter measure | Actual | Street estimate | Year earlier | Comparison |
|---|---|---|---|---|
| Sales | $4.522 billion | $4.610 billion | $4.289 billion | Shortfall of 1.9%; up 5% year-on-year |
| Adjusted EPS | $1.87 | $2.12 | $2.75 | 11.8% below expectations; 32% lower |
| Adjusted EBIT | $995 million | — | $1.066 billion | Down 7% from previous year |
| Backlog | $18.154 billion | — | $16.600 billion | Increase of 9% |
The adjusted EBIT margin dropped to 22.0% compared with 24.9%, marking a decrease of 285 basis points. Sales rose 5%. The shortfall in conversion outweighed the slight miss on revenues.
Profit pressure appeared in specific areas rather than across the board. The margins shown below use segment data as reported.
| Business | Sales growth | Adjusted EBIT change | Q2 2026 margin | Q2 2025 margin | Investor read-through |
|---|---|---|---|---|---|
| Electronic Solutions | +8% | -$16 million | 25.9% | 28.9% | Higher costs and mix outweighed increased volumes |
| Engines and Power Systems | +1% | -$82 million | 12.4% | 18.4% | Accounted for 115% of the net EBIT reduction |
| Control Systems | +7% | +$28 million | 29.0% | 28.8% | Helped cushion broader area softness |
| Total company | +5% | -$71 million | 22.0% | 24.9% | Margin dropped roughly 285 basis points |
Chief Executive Jim Currier stated, “Our actions thus far just have not been good enough.” Honeywell is currently adding over 50 new suppliers, with an additional 50 targeted for later in the year. The company’s spending on supplier tooling is expected to increase by 20% compared with the first half. Reuters
The revised guidance lowered forecasts for both earnings and revenue growth.
| 2026 measure | Previous guidance | Current guidance | Midpoint change or comparison |
|---|---|---|---|
| Organic sales growth | 7%-9% | 4%-5% | Declines by 3.5 percentage points |
| Pro forma adjusted EBIT | $4.65-$4.75 billion | $4.35-$4.45 billion | Decrease of $300 million |
| Pro forma adjusted EPS | Not previously issued | $7.60-$7.90 | Midpoint is 12.5% under $8.86 consensus |
| Second-half free cash flow | $1.0-$1.5 billion | $1.0-$1.5 billion | No change |
Adjusted EBIT guidance at the midpoint dropped by $300 million, a 6.4% decrease. The updated EPS midpoint is now 12.5% under consensus estimates. Guidance for second-half free cash flow was not revised.
HONA is priced at $182.83, equating to 23.6 times its projected 2026 adjusted earnings per share. At the close on Wednesday, the stock traded at a multiple of 26.3. Both figures are based on the midpoint of management’s pro forma guidance. The decline in the price-to-earnings ratio is partially due to a decrease in the underlying earnings.
Analyst recommendations were issued prior to Wednesday’s earnings. Their price targets could now be out of date. Upside listed below is based on the $182.83 extended session price.
| Research firm | Date | Recommendation | Price target | Calculated upside |
|---|---|---|---|---|
| BMO Capital Markets, a division of Bank of Montreal NYSE:BMO | July 2 | Outperform | $276 | 51.0% |
| Argus Research | July 9 | Buy | $275 | 50.4% |
| JPMorgan Chase NYSE:JPM | July 10 | Neutral | $255 | 39.5% |
| Evercore ISI, a unit of Evercore Inc. NYSE:EVR | July 13 | In Line | $250 | 36.7% |
| UBS Group NYSE:UBS | July 20 | Neutral | $231 | 26.3% |
| Consensus, 15 analysts | Pre-results | Hold | $253.75 | 38.8% |
The pre-results consensus included 10 hold ratings and five positives, with no sells. In the coming week, analysts are expected to update estimates and price targets. The new revisions are likely to be more significant than the previous implied upside.
HONA rose 6.0% between July 30 and Tuesday, but its after-hours price on Wednesday was 10.5% under the July 30 close. The move wiped out the short-lived rally ahead of earnings.
The company started normal trading on June 29 following its split from Honeywell Technologies NASDAQ:HON. Executives continue to support their goals for 2030. This year, the company reported $15 billion in projected lifetime wins. The speed at which these wins turn into cash now depends on near-term production.
Risks: Recovery among suppliers, notably in castings, could remain slow. EBIT may stay subdued due to a supply mix weighted toward lower-margin deliveries. Downside risk would ease if supplier qualification accelerates or if aftermarket demand rebounds.
Looking ahead to Thursday and the following week, three indicators take precedence: engine margins, aftermarket expansion, and updated EPS forecasts. The backlog provides evidence of continued demand. However, the quarter highlighted ongoing issues with conversion.






![US Stock Market Today 08/26/2026 [UPDATE: 03:08 EDT] [QQQ Halves Loss as Semtech Reclaims 4.5% Overnight Gain]](https://ts2.tech/wp-content/uploads/2026/08/US-market-dashboard-2026-08-26-0307-480x384.jpg "US Stock Market Today 08/26/2026 [UPDATE: 03:08 EDT] [QQQ Halves Loss as Semtech Reclaims 4.5% Overnight Gain]")