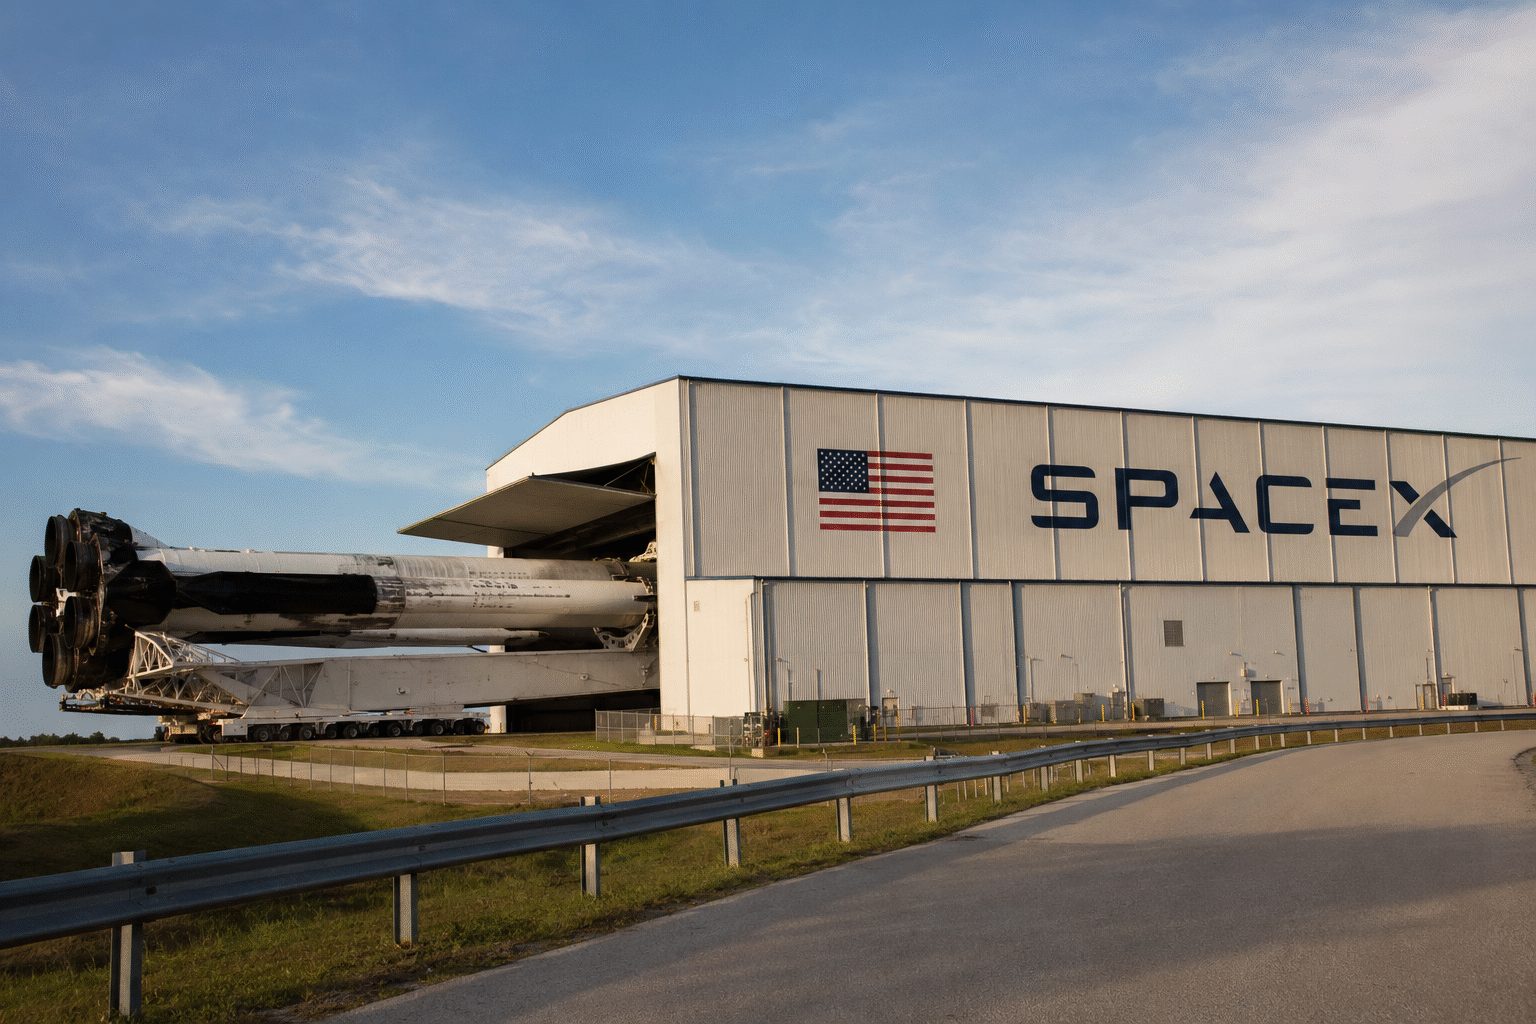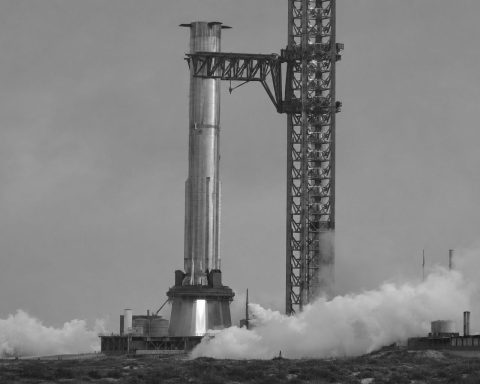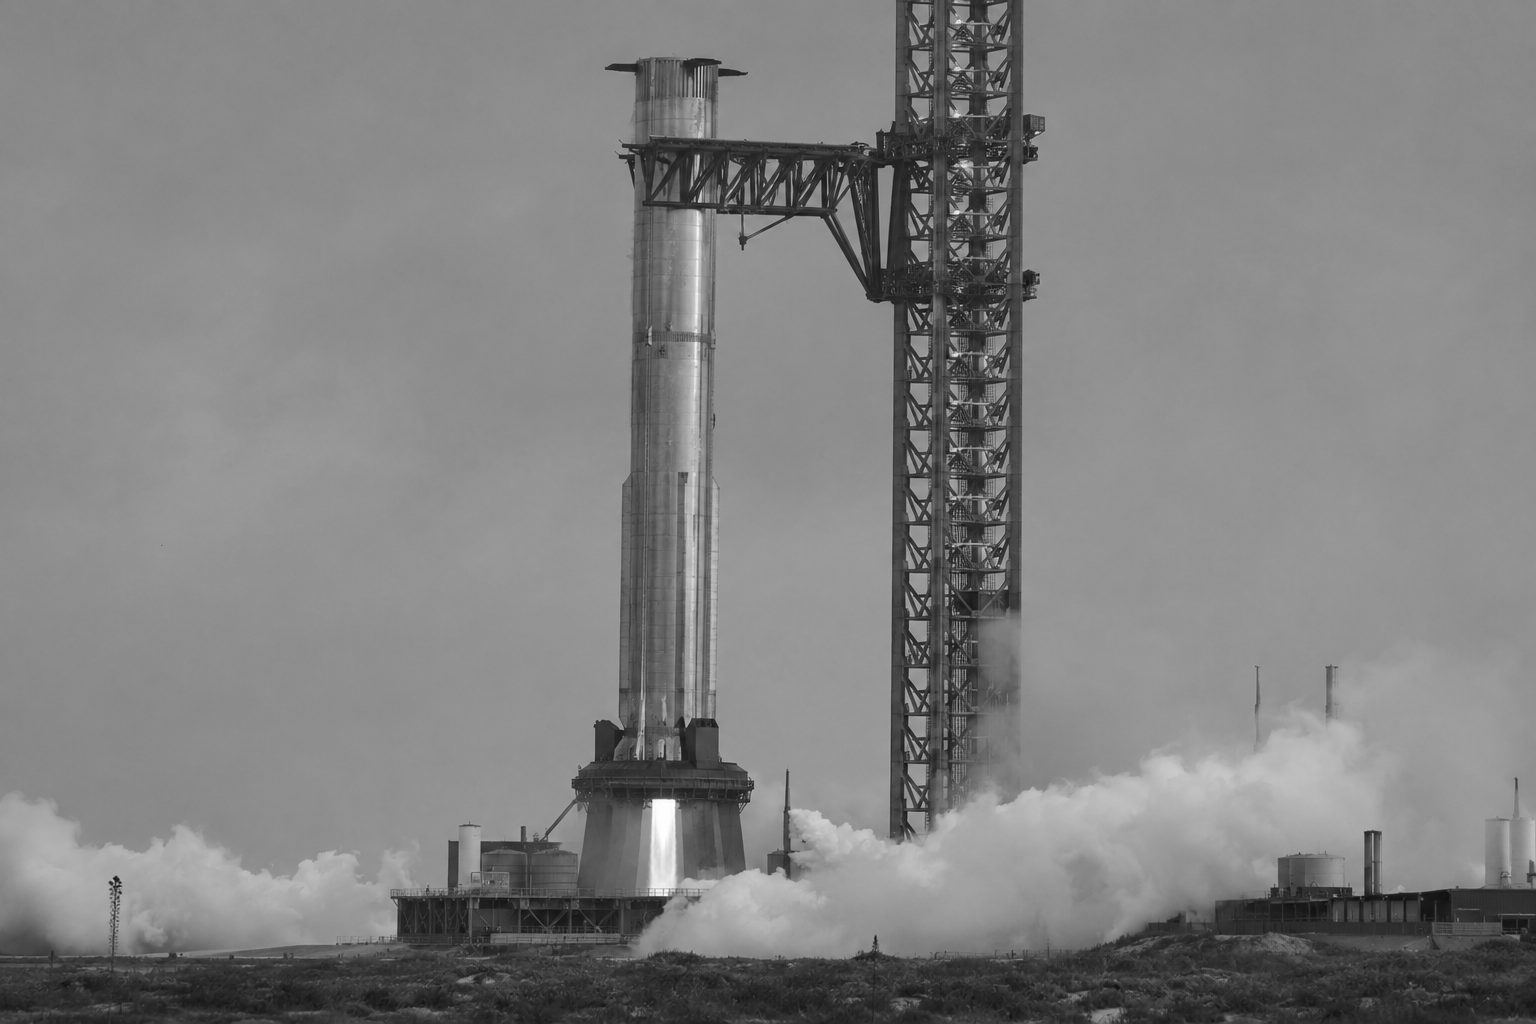
SpaceX has moved Starship Flight 14 into September after completing a full-duration static fire of Booster 21. The schedule shift turns a rocket test into a valuation checkpoint for shareholders.
Orbital capability is the bridge between experimental hardware and scalable capacity.
Flight 14 combines the first orbital trajectory, a viable payload and a possible Ship 41 tower catch. Success would lower three uncertainties at once: performance, reuse and deployment capacity.
| Test | Flight 13 result | Flight 14 objective | Financial signal |
|---|---|---|---|
| Trajectory | Suborbital | First orbital flight | Broadens commercial launch utility |
| Payload | Upgraded Starlink deployment | Viable orbital payload | Links vehicle to revenue capacity |
| Ship recovery | Soft splashdown; later recovered | Possible tower catch | Tests rapid reuse |
| Booster | Landing-burn failure | V3 Booster 21 | Execution risk remains visible |
Booster 21 proof campaign
Structural and tank validation.
33-engine static fire
Full booster propulsion test.
Ship 41 campaign
Complete testing and pad work.
Stack + notices + FAA
No firm launch date confirmed.
At about 59 times annualized Q2 revenue, the market assumes Starship becomes more than a development program. Flight 14 can reduce that execution discount by proving orbit, payload delivery and recoverability in one mission.
What changes the view: Ship 41 static fire, vehicle stacking, FAA operational approval and SpaceX launch confirmation.
| Q2 BDS revenue | $7.483B | +13% YoY |
| Q2 BDS operating margin | -0.2% | -1.9 pts YoY |
| BDS backlog | $85B | 27% international |
| Company cash + securities | $20.0B | Q2 end |
| Consolidated debt | $45.9B | Q2 end |
| VC-25B Q2 loss charge | $280M | Margin warning |
| Company | Latest price | Move | Market cap | P/E |
|---|---|---|---|---|
| Boeing (BA) | $211.08 | +0.29% | $166.83B | 96.1× |
| Lockheed Martin (LMT) | $556.52 | -1.35% | $128.44B | 20.5× |
| General Dynamics (GD) | $376.58 | -1.88% | $101.89B | 23.0× |
| Northrop Grumman (NOC) | $542.52 | -1.24% | $77.25B | 17.3× |
Latest feed values checked Aug. 26 at 04:39 EDT; BA close and after-hours data are timestamped Aug. 25. Peer feeds may reflect their latest available extended-hours print.
Sources: U.S. contract notice dated Aug. 24, Boeing Q2 results dated July 28, WSJ market data, MarketBeat analyst aggregation and latest market feeds. Ratios are calculated from displayed inputs. Ceiling value is not guaranteed revenue or backlog.
Strike authority meets a certification-led recovery.
| Q2 metric | 2026 | YoY |
|---|---|---|
| Revenue | $24.56bn | +8% |
| Commercial deliveries | 171 | +14% |
| Free cash flow | $631m | +$831m |
| Backlog | $715bn | +16% |
| View | Target | Upside |
|---|---|---|
| Consensus: Buy | $274.85 | +28.3% |
| Argus: Buy | $265 | +23.7% |
| Bernstein: Buy | $298 | +39.1% |
| Tigress: Buy | $305 | +42.4% |
The stock fell every session last week. The contract rejection now adds schedule risk to the 737-10 and 777-9 certification campaigns. Friday's -0.42% also lagged the S&P 500 by 0.85 percentage point.
Renewed talks or revised terms could remove the October overhang. Continued delivery growth and positive free cash flow would support the analyst recovery case.
Price and returns: Aug. 21, 2026 close. Retrieved Aug. 22, 2026, 07:04 CEST.
Average target implies 19.6% upside from Friday’s close; low target is 0.3% above it.
| Metric | H1 2026 | H1 2025 | Change |
|---|---|---|---|
| Adjusted sales | €4.157bn | €2.847bn | +46% |
| Operating income | €330m | €180m | +83% |
| Order intake | €2.878bn | €8.075bn | −64% |
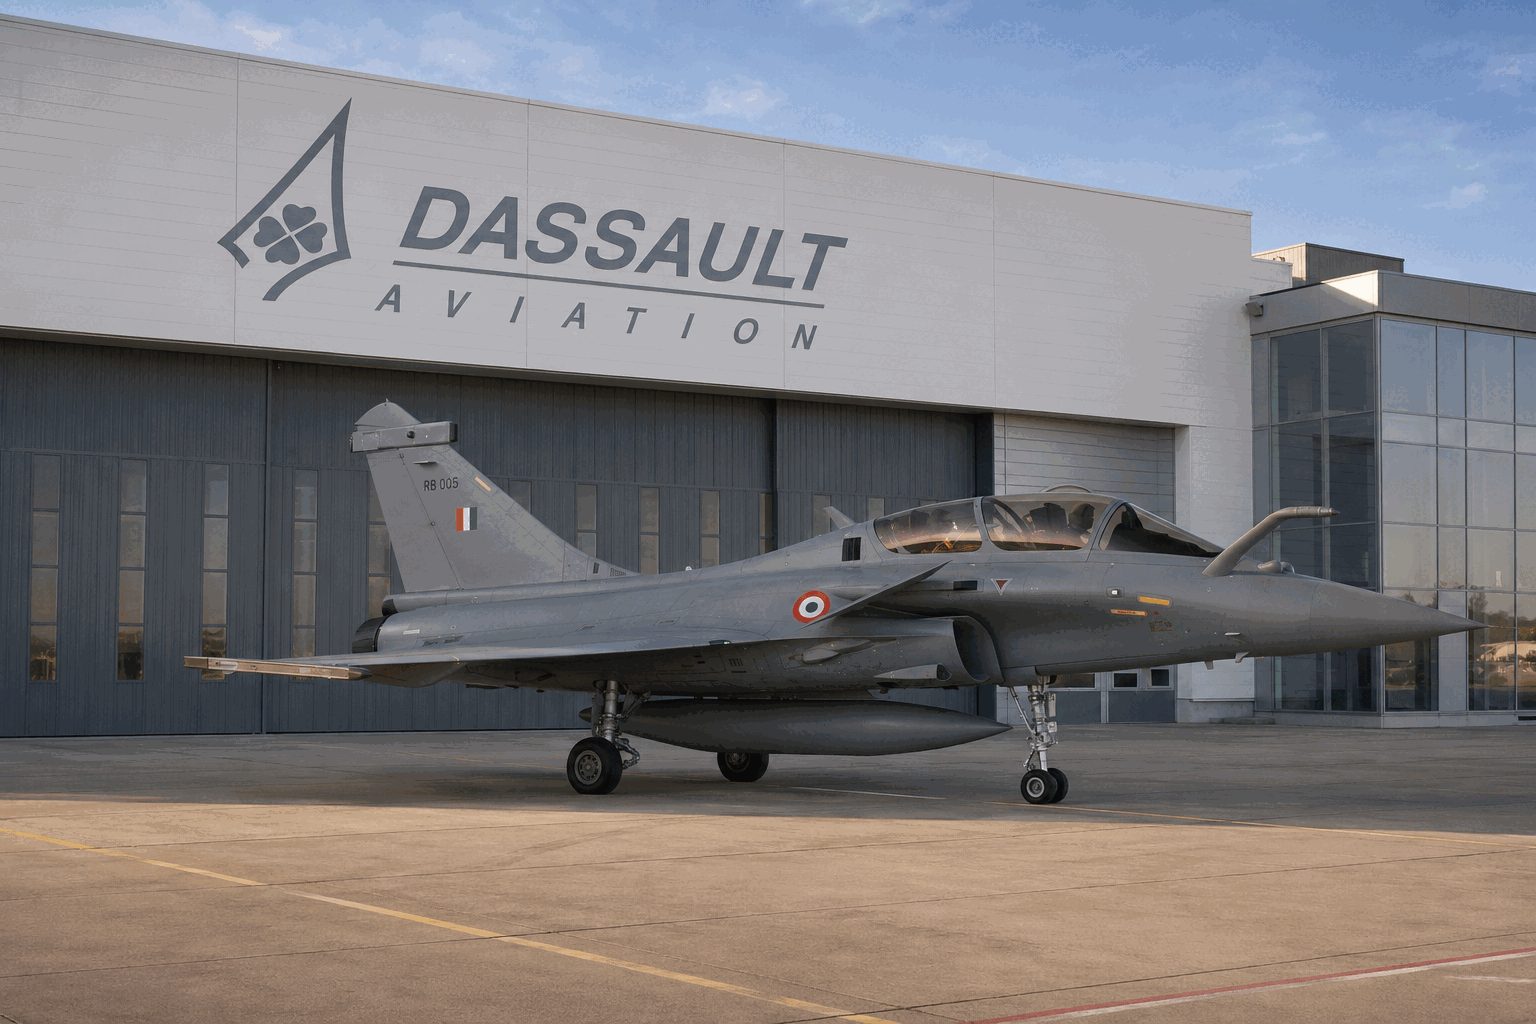
| Rafale deliveries | 12 | 7 | +71% |
Backlog was €45.36bn at June 30, including 208 Rafales and 83 Falcons.
A firm order with disclosed economics would narrow uncertainty. Delay, repricing or more local content would keep the headline count from mapping cleanly to earnings.
Watch for bargaining dates, a member survey and any change to Boeing’s contingency plan.
Export demand is strong. The investable question is when proposals become backlog.
India's proposal equals 54.8% of the existing 208-Rafale backlog.
| Metric | H1 2026 | YoY |
|---|---|---|
| Adjusted sales | €4.157bn | +46.0% |
| Operating income | €330m | +83.3% |
| Operating margin | 7.9% | +1.6 pts |
| Order intake | €2.878bn | −64.4% |
| Metric | YoY |
|---|---|
| Revenue | +12% |
| Adjusted EBIT | +24% |
| Net income | +47% |
| Commercial deliveries | +15% |
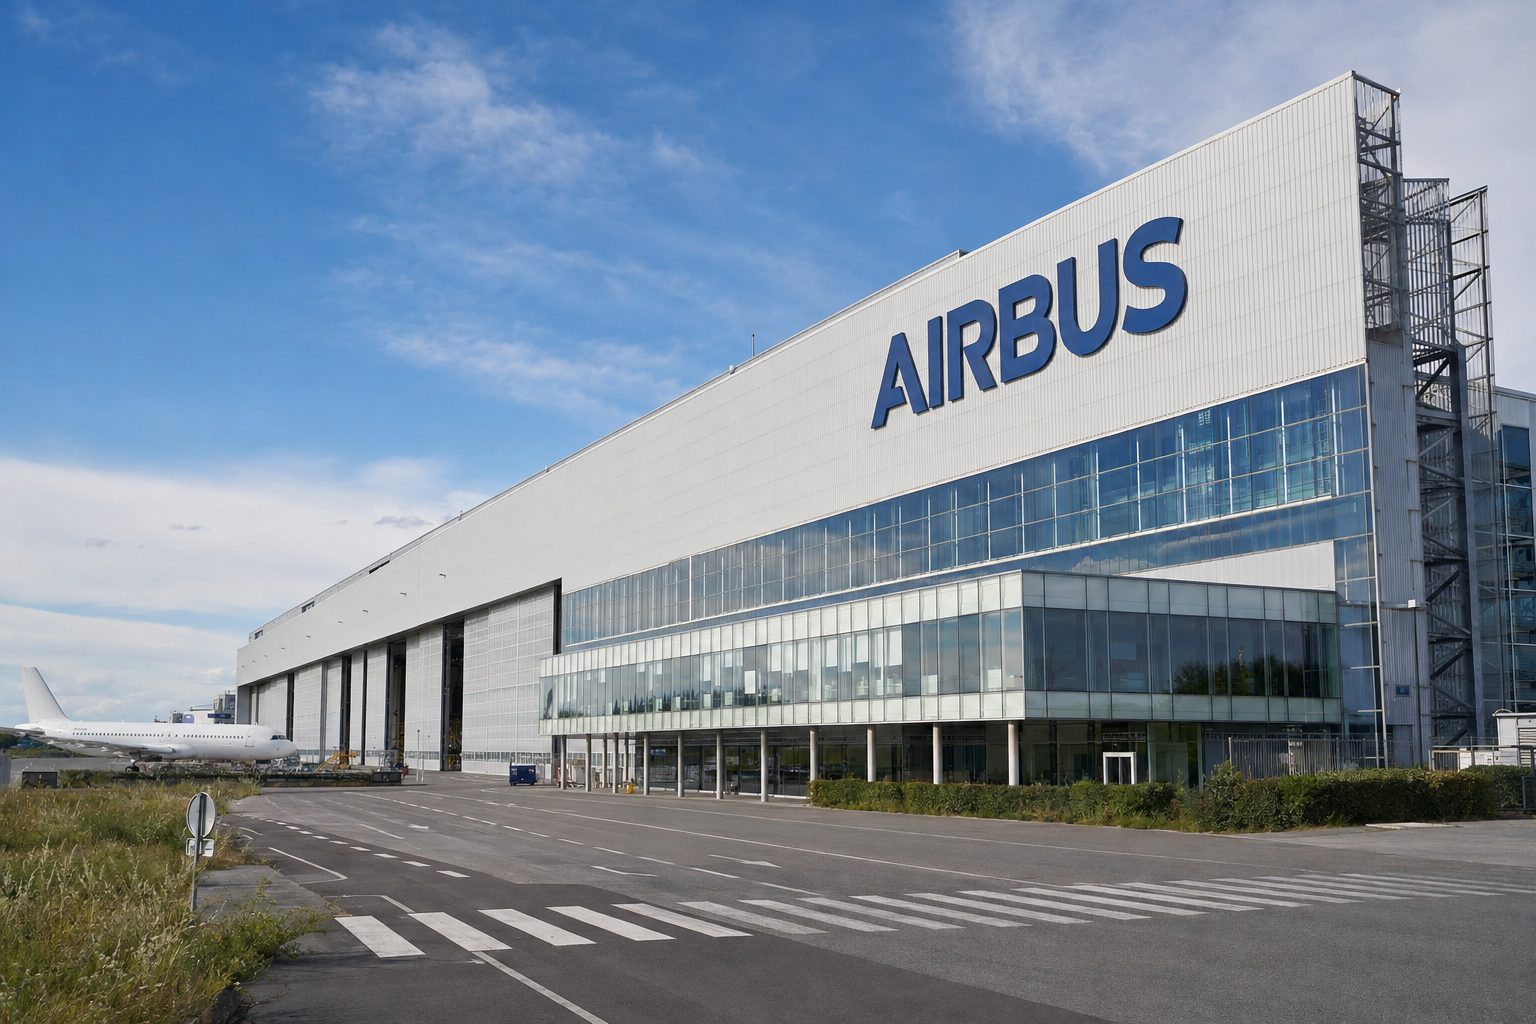
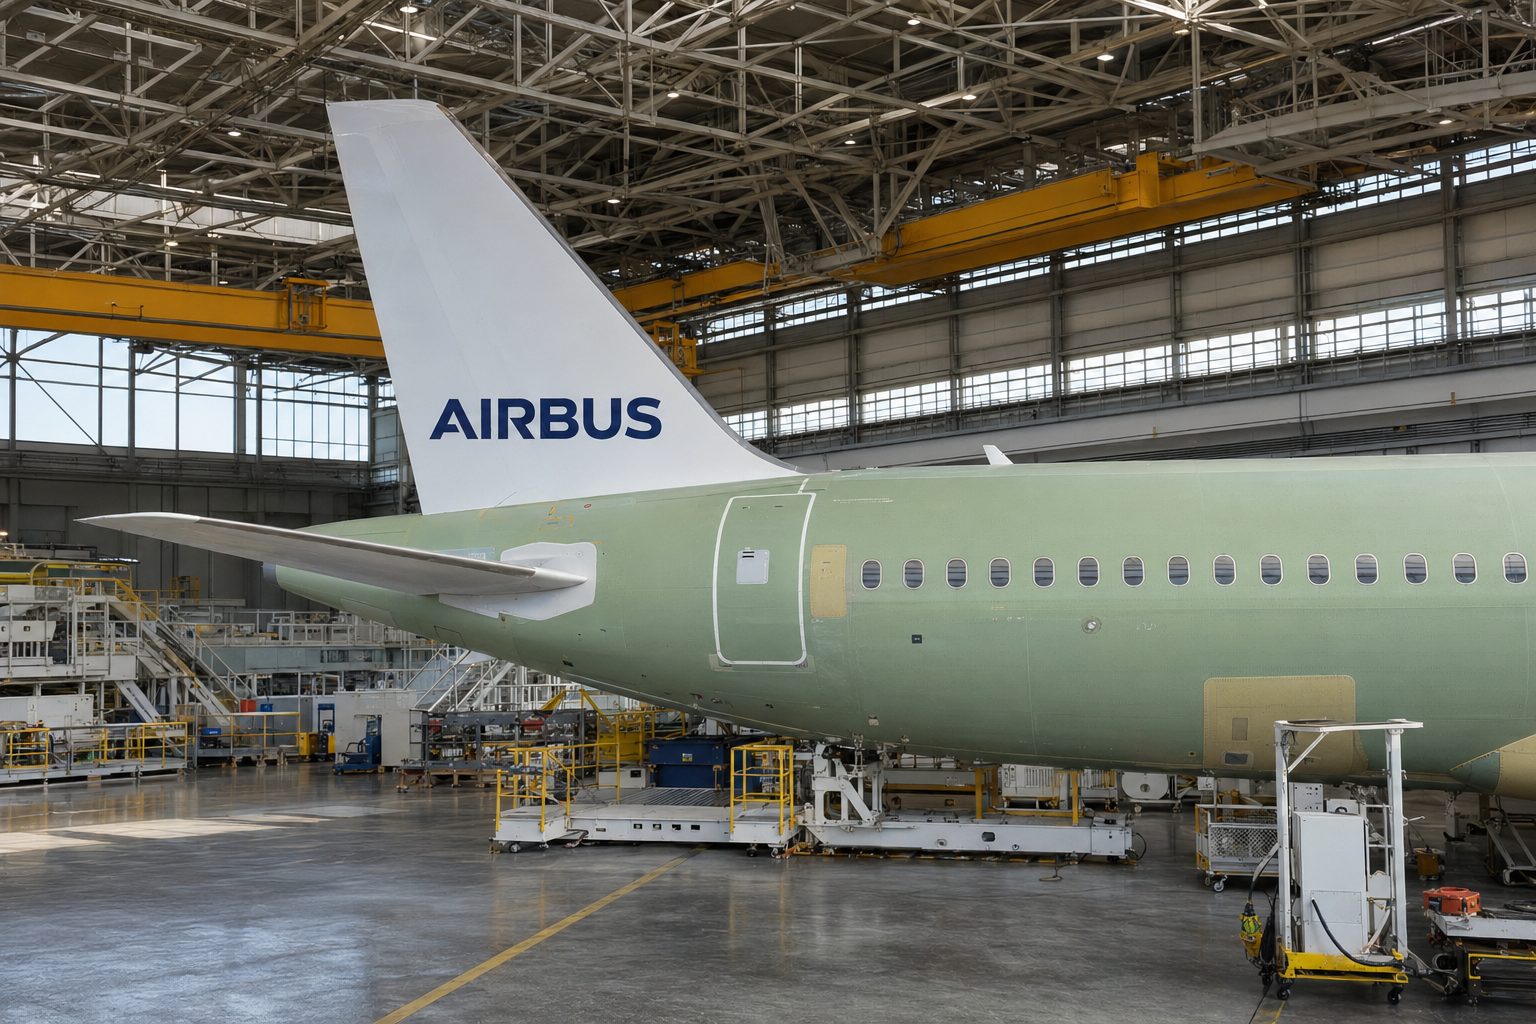
*Calculated against the stated market snapshot. Sources: Airbus H1 2026, Airbus Toulouse FAL, S&P Global analyst poll via StockAnalysis, Welt market snapshot. Backlog-duration figures are static calculations.
| Firm | View | Target | Upside |
|---|---|---|---|
| Argus | Buy | $265 | 19.3% |
| Tigress | Buy | $305 | 37.3% |
| BNP Paribas | Outperform | $300 | 35.0% |
| JPMorgan | Overweight | $290 | 30.5% |
| RBC | Outperform | $265 | 19.3% |
Six percent below the €221.30 52-week high. Volume was 0.62 times average.
Consensus target: €229.74Airbus delivered 351 aircraft in H1. Another 519 are needed to reach about 870.
The target rate is 55%–66% above the H1 delivery pace. Production timing differs from handovers.
Simple coverage: 9,222 total jets at 870 yearly; 7,499 A320s at 75 monthly.