
NEW YORK, August 6, 2026, 06:06 EDT
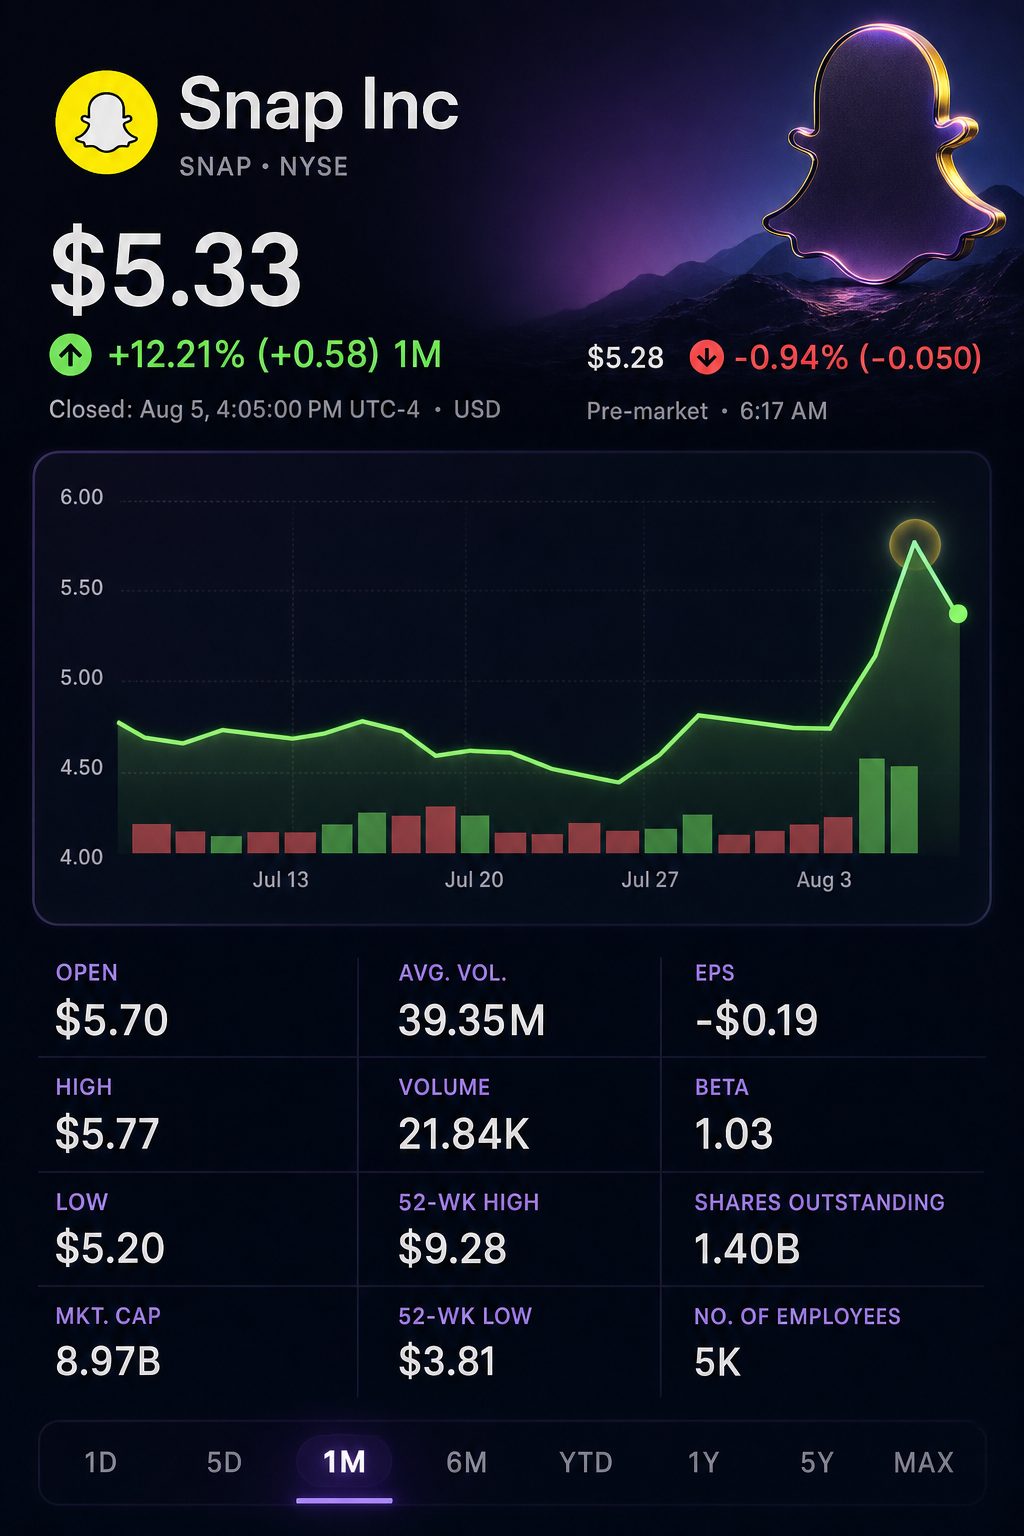
- Snap was down 1.1% at $5.27 in after-hours premarket trade.
- Approximately 57% of the additional sales in Q2 were contributed by subscription-driven Other Revenue.
- The consensus recommendation from 30 analysts is Hold, and the average price target stands at $7.44.
Snap Inc. NYSE:SNAP edged down 1.1% ahead of Thursday’s market open, as the company reported that new revenue in Q2 was driven mainly by subscriptions rather than advertising. Shares dropped 7.9% in Wednesday’s session.
Other Revenue driven by subscriptions surged 85% to $316 million, accounting for 19.8% of overall sales compared to about 12.7% previously. Based on the company’s rounded figures, this segment contributed about 57% of Snap’s $254 million rise in yearly revenue.
Advertising income increased by 9% to $1.28 billion, continuing to represent around 80% of Snap’s total business. Because advertising remains the dominant segment, slower growth in this area has a greater impact.
The market’s initial response was robust. On Wednesday, 61% of Tuesday’s dollar increase was wiped out. Despite this, Snap was still up 13.7% compared to Friday’s closing price.
| Trading date | Close | Daily move | Volume | Context |
|---|---|---|---|---|
| Aug. 3 | $5.04 | +7.46% | 91.44 million | Results posted after the market closed |
| Aug. 4 | $5.79 | +14.88% | 88.73 million | First session fully reflecting results |
| Aug. 5 | $5.33 | -7.94% | 75.23 million | Second session after results published |
The tape shows a divided outlook. Cash generation is now much stronger. Core ad growth continues to lag bigger platforms.
The revenue bridge highlights the importance of context for the 19% headline. Other Revenue contributed more additional dollars than advertising.
| Q2 revenue stream | 2025 | 2026 | Year-on-year growth | Share of total dollar growth |
|---|---|---|---|---|
| Total revenue | $1.345 billion | $1.599 billion | 19% | 100% |
| Advertising | Roughly $1.174 billion | $1.283 billion | 9% | Roughly 43% |
| Other/direct | Roughly $171 million | $316 million | 85% | Roughly 57% |
Reporter calculations based on approximate company growth rates. Figures do not represent company guidance.
Snap’s advertising platform underperformed compared to similar public peers. User base definitions vary, making direct comparisons in user growth challenging. Revenue differences remained considerable.
| Company | Q2 revenue growth | Q2 ad growth | Audience growth |
|---|---|---|---|
| Snap Inc. NYSE:SNAP | 19% | 9% | DAU up 5% |
| Meta Platforms Inc. NASDAQ:META | 28% | 27% | DAP up 3% |
| Pinterest Inc. NYSE:PINS | 18% | Not disclosed separately | MAU up 11% |
| Reddit Inc. NYSE:RDDT | 61% | 64% | DAUq up 18% |
Worldwide daily active users totaled 493 million, an increase of 5%. DAUs in North America declined by 7%, European DAUs slipped 2%, and DAUs in the Rest of the World climbed 12%.
Monetisation eased some of the strain. Average revenue per user in North America climbed 23%. In Europe, ARPU was up 36%.
Cash flow has strengthened. Over the past 12 months, free cash flow totaled $706 million, with eight consecutive quarters in positive territory. With a market capitalization near $9 billion, this results in a trailing FCF yield of approximately 7.8%.
Dilution remains a concern. Snap projects approximately $1.05 billion in stock-based compensation for the year. The company intends to offset dilution through buybacks, using primarily free cash flow.
Chief Executive Evan Spiegel said, “Q2 reflects the progress we are making to strengthen our core business.” The company’s management has designated free cash flow per share as its primary financial target. investor.snap.com
Snap forecast third-quarter revenue between $1.70 billion and $1.74 billion and projected adjusted EBITDA in the range of $300 million to $350 million. The company increased its outlook for full-year infrastructure expenses by $50 million on both the low and high ends, citing additional investment primarily for AI technology.
The majority of analysts maintain a Hold rating. Out of 30 analysts tracked by Google Finance, 24 recommend Hold, five suggest Buy, and one rates Sell. Price targets fall between $5 and $16.
| Firm | Analyst | Recommendation | Target | Latest action date |
|---|---|---|---|---|
| Barclays PLC NYSE:BCS | Ross Sandler | Buy | $16.00 | Aug. 4 |
| Evercore Inc. NYSE:EVR | Mark Mahaney | Hold | $8.00 | Aug. 4 |
| Piper Sandler Companies NYSE:PIPR | Thomas Champion | Hold | $8.00 | Aug. 4 |
| Citigroup Inc. NYSE:C | Ronald Josey | Hold | $6.75 | Aug. 5 |
| JPMorgan Chase & Co. NYSE:JPM | Doug Anmuth | Sell | $6.00 | Aug. 4 |
| UBS Group AG NYSE:UBS | Stephen Ju | Hold | $5.70 | Aug. 4 |
Doug Anmuth of JPMorgan noted that Snap is starting to see results from its work on monetisation and profitability. However, he emphasised that consistent execution remains necessary.
Potential risks involve loss of users in established markets, sluggish advertising revenue increases and rising expenses for AI. Legal challenges involving younger users may prompt changes to products or additional legal costs. Snap must also secure funds to counteract dilution from stock-based compensation.
Less than 3% of monthly active users are paying customers at present, providing significant room for growth in conversions. Further re-rating relies on an upturn in advertising revenue, provided it does not diminish free cash flow per share.
Related articles: NYSE:SNAP