
NEW YORK, August 5, 2026, 17:11 EDT — With main U.S. trading hours ended, after-hours activity continued.
- Shares dropped by up to 28.7%, with the session’s low suggesting an early equity value loss of $40.2 billion.
- Revenue fell short of expectations by 0.8%. The midpoint for the third quarter was 0.5% under consensus.
- Estimated cash taxes increased by $426.5 million from the prior period, nearly equaling the decline in free cash flow.
AppLovin NASDAQ:APP shares dropped over 20% after the market closed on Wednesday. The company reported revenue that came in below expectations and provided a sales outlook with a somewhat weak midpoint. Shares reached a low of $298, representing a 28.7% decline.
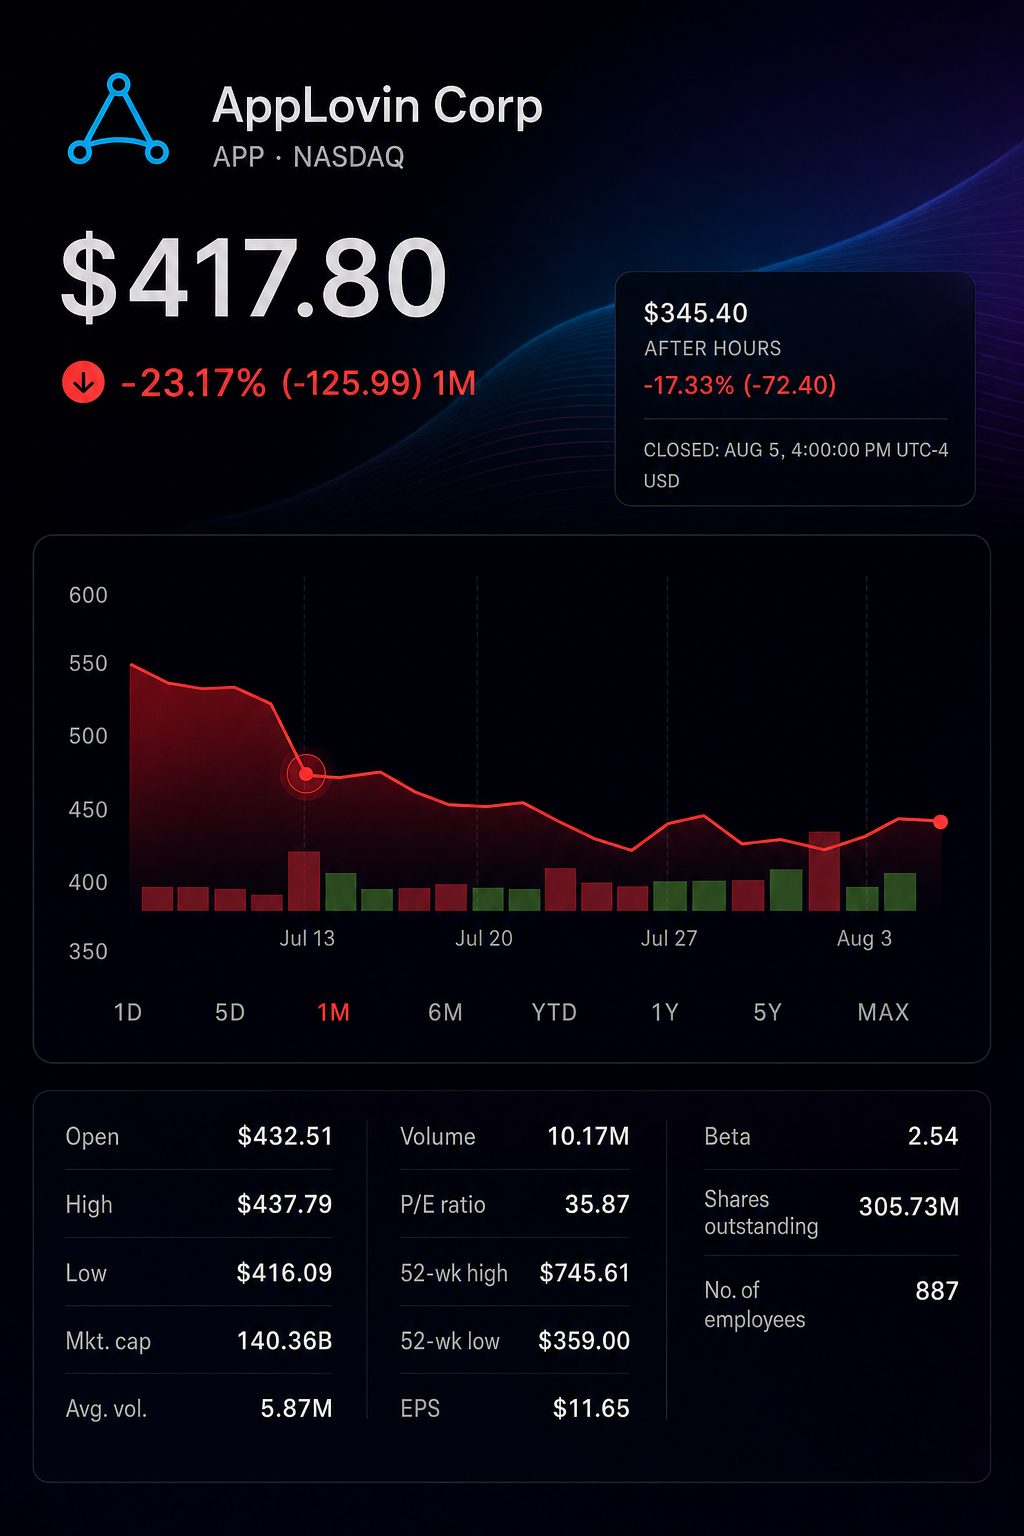
The response far exceeded the impact of the earnings miss. Based on quarter-end share figures, the drop wiped out $40.2 billion in equity value at its lowest point, even though the revenue fell short by just $16.3 million.
The disparity indicates a shift in expectations rather than a drop in earnings. AppLovin was trading at 35.9 times trailing earnings ahead of the release. Minor revenue shortfalls resulted in significant consequences.
The quarter surpassed earnings expectations, but revenue fell short. Adjusted EBITDA was also slightly under AppLovin’s previous guidance range.
| Metric | Q2 result | Benchmark | Gap |
|---|---|---|---|
| Revenue | $1.924 billion | Street: $1.940 billion | -0.8% |
| Diluted EPS | $3.76 | Street: $3.75 | +$0.01 |
| Adjusted EBITDA | $1.614 billion | Company guide: $1.615-$1.645 billion | $1.2 million under lower end |
Revenue advanced 53% compared to the same period last year. Net income jumped 55% to $1.267 billion. Adjusted EBITDA was up 58%. These are still exceptionally strong growth rates.
Cash conversion appeared notably weaker. Free cash flow declined by 32.9% compared to the previous quarter. Sequential increases were seen in both revenue and adjusted EBITDA.
| Metric | Q1 2026 | Q2 2026 | Sequential change |
|---|---|---|---|
| Revenue | $1.842 billion | $1.924 billion | up 4.4% |
| Adjusted EBITDA | $1.557 billion | $1.614 billion | increased 3.7% |
| Free cash flow | $1.287 billion | $863.3 million | fell 32.9% |
| Free-cash-flow margin | 69.8% | 44.9% | down 24.9 points |
| Cash taxes | $106.7 million | $533.1 million | rose by $426.5 million |
Initial estimate. Cash taxes for the second quarter are calculated as first-half payments less the first-quarter figure.
Nearly the entire drop in cash flow is attributed to tax timing. Cash taxes paid rose by $426.5 million, while free cash flow decreased by $423.4 million. Additional cash usage occurred from receivables and accrued liabilities, indicating taxes were not the sole driver.
Forecast continues to indicate strong quarter-on-quarter growth. However, the $2.070 billion midpoint for revenue was $10 million under consensus expectations. That minor shortfall was significant.
| Metric | Q2 actual | Q3 guidance | Midpoint change |
|---|---|---|---|
| Revenue | $1.924 billion | $2.055-$2.085 billion | +7.6% |
| Adjusted EBITDA | $1.614 billion | $1.710-$1.740 billion | +6.9% |
| Adjusted EBITDA margin | 83.9% | 83% | -0.9 points |
| Revenue versus Street | — | $2.070 billion midpoint compared to $2.080 billion | -0.5% |
Chief Executive Adam Foroughi spoke directly about the push into consumer markets in May. “We just have to go execute on it,” he stated. The response on Wednesday indicates that investors are now weighing execution to the nearest fraction of a percent. Investing.com
Analyst recommendations released prior to the results were widely favorable. All price targets surpassed the regular session close of $417.80 recorded Wednesday.
| Firm | Analyst | Recommendation | Target | Upside versus close | Date |
|---|---|---|---|---|---|
| UBS Group NYSE:UBS | John Hodulik | Buy | $798 | 91.0% | Aug. 3 |
| Wells Fargo NYSE:WFC | Alec Brondolo | Overweight | $575 | 37.6% | July 7 |
| Raymond James Financial NYSE:RJF | Andrew Marok | Strong Buy | $640 | 53.2% | June 29 |
| Citigroup NYSE:C | Jason Bazinet | Buy | $710 | 69.9% | June 1 |
| Needham & Co. | Bernie McTernan | Buy | $700 | 67.5% | May 28 |
Those targets are outdated. The next important indicator will be if analysts reduce earnings forecasts instead of just adjusting price targets.
AppLovin shares rose 4.6% between July 29 and Wednesday’s close ahead of its earnings report. That gain, along with additional value, was wiped out after the results in after-hours trading.
The next sector test comes on Thursday when The Trade Desk NASDAQ:TTD releases results after markets close, with its earnings call scheduled for 17:00 EDT. Shares closed Wednesday at $18.96, trading at 21.5 times trailing earnings—a lower multiple than AppLovin ahead of its own release.
Risks: AppLovin notes challenges including forecasting accuracy, scaling customers, ad market competition and developments in new technologies. Limited after-hours liquidity may amplify price fluctuations. Shares could recover if tax payments are only short-term and analysts stand by their projections.
The investor question is now clear: Can 53% sales growth continue to meet a valuation standard that penalized a miss of less than 1%?
Related articles: NASDAQ:APP






![Asia Stock Market Today 26/08/2026 [UPDATE: 07:03 SGT] [Korea Opens Block Trading After Asia’s Broad Rebound]](https://ts2.tech/wp-content/uploads/2026/08/Asia-market-dashboard-2026-08-26-0703-480x384.jpg "Asia Stock Market Today 26/08/2026 [UPDATE: 07:03 SGT] [Korea Opens Block Trading After Asia’s Broad Rebound]")