
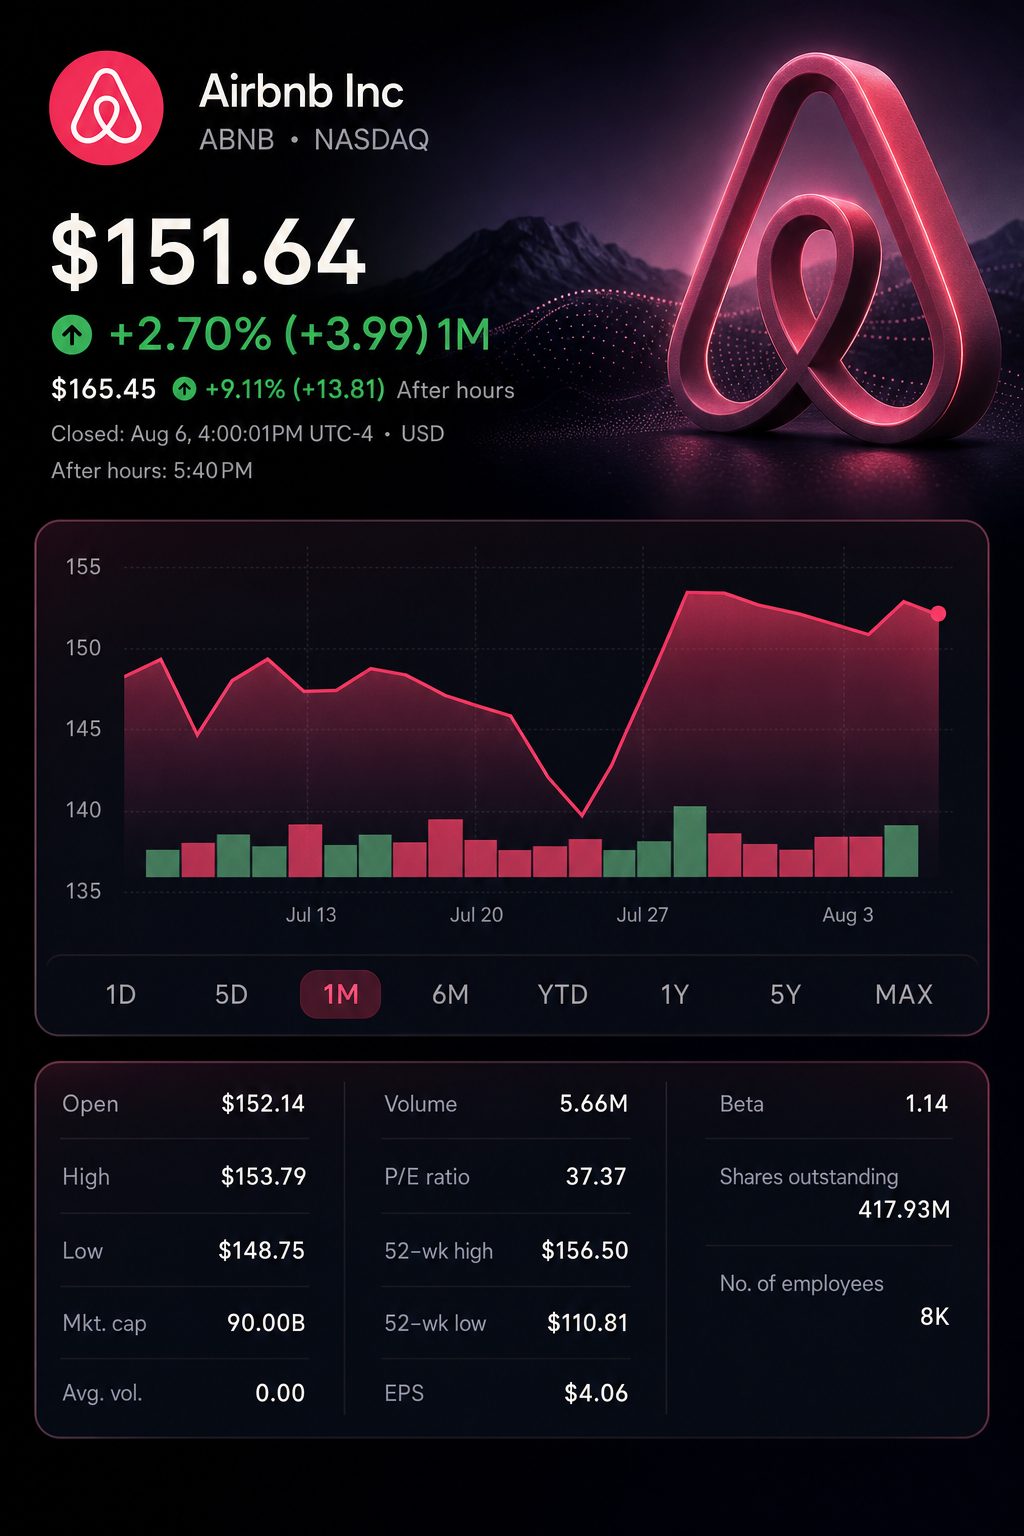
NEW YORK, August 6, 2026, 17:13 EDT — U.S. regular trading ended, with aftermarket activity ongoing.
- Shares climbed 8.5% to $164.48 in initial after-hours trading, following a close at $151.64.
- Revenue climbed 17%, and adjusted EBITDA was up 21%. Spending on sales and marketing advanced 27%.
- Annual revenue is projected to climb by at least the mid-teens percentage. The minimum margin increased to 35.5%.
Airbnb lifted its full-year revenue and margin forecasts following a strong second-quarter performance, driven by increased demand in both mature and rapidly expanding markets. Shares surged in after-hours trading.
The key investor takeaway appeared in the cost structure. Sales and marketing expenses climbed 27% to $875 million, while revenue advanced 17%. Adjusted EBITDA margin expanded by a point to reach 35%.
Customer-support spending per booking dropped roughly 16%. Airbnb attributed some of this reduction to its AI assistant. Together, these factors imply efficiency improvements contributed to funding increased customer acquisition efforts.
Airbnb surpassed consensus projections for revenue, earnings, gross bookings, and its outlook for third-quarter sales. All surprise percentages are based on company reports and publicly available analyst forecasts.
| Measure | Reported or guided | Consensus | Difference |
|---|---|---|---|
| Q2 revenue | $3.61 billion | $3.58 billion | +0.8% |
| Q2 diluted EPS | $1.37 | $1.26 | +8.7% |
| Q2 gross booking value | $27.20 billion | $26.45 billion | +2.8% |
| Q3 revenue midpoint | $4.73 billion | $4.61 billion | +2.6% |
The earnings were not driven by increased fees. The number of nights and seats booked climbed 10%, and average daily rates were up 5%. Gross booking value saw a 16% rise. The take rate was unchanged at 13.2%.
Trip value and volume drove the result.
Airbnb described the widespread acceleration as “one of the most encouraging trends in Q2.” The company highlighted the United States, France, Britain and Australia as standout performers. Night bookings in North America saw their quickest growth in nearly three years. In Latin America, growth was approximately 20%, while in Asia-Pacific it reached the high teens. Q4 Capital
The operating mix illustrates that margins remained steady even as marketing expenses increased. Figures are stated in millions.
| Measure | Q2 2025 | Q2 2026 | Change |
|---|---|---|---|
| Revenue | $3,096 | $3,608 | +17% |
| Sales and marketing | $691 | $875 | +27% |
| Sales and marketing/revenue | 22.3% | 24.3% | +1.9 points |
| Operations and support | $332 | $361 | +9% |
| Adjusted EBITDA | $1,043 | $1,261 | +21% |
| Adjusted EBITDA margin | 34% | 35% | +1 point |
The proportion of app-based nights rose by 23%, making up 64% of all nights compared to 59% previously. The number of first-time bookers grew 11%, marking the quickest growth rate in four years. These figures back the argument for product-led growth.
Management increased both of its full-year targets. Projected revenue growth shifted from low-to-mid teens up to at least mid-teens. The minimum adjusted EBITDA margin was raised from 35% to 35.5%.
| Measure | May 7 outlook | August 6 outlook |
|---|---|---|
| Full-year revenue growth | Low-to-mid teens | Mid-teens or higher |
| Full-year adjusted EBITDA margin | At least 35.0% | Minimum 35.5% |
| Q3 revenue | Not issued | $4.69 billion-$4.77 billion |
| Q3 revenue growth | Not issued | 15%-17% |
| Q3 adjusted EBITDA margin | Not issued | Down slightly from a year earlier |
The midpoint for the third quarter is 2.6% higher than the stated consensus. Roughly three percentage points of forecast growth are attributed to currency effects. Executives see the quarter’s margin dipping modestly due to altered timing of investments.
Valuation has become the current hurdle. Before results, the consensus target from 39 analysts was $160.65. The initial after-hours price of $164.48 was 2.4% higher than that mean.
The most recent recommendations prior to the results indicated a broad range of valuations.
| Date | Brokerage | Analyst | Recommendation | Price target |
|---|---|---|---|---|
| July 30 | UBS Group NYSE:UBS | Stephen Ju | Neutral | $163, up from $157 |
| July 30 | Morgan Stanley NYSE:MS | Brian Nowak | Underweight | $125, up from $120 |
| July 16 | Wedbush | Scott Devitt | Neutral | $152 |
| July 14 | Jefferies Financial Group NYSE:JEF | John Colantuoni | Buy | $175, up from $160 |
| June 29 | Robert W. Baird | Colin Sebastian | Outperform | $160, up from $150 |
| Consensus | 39 analysts | — | Moderate Buy | $160.65 |
Share buybacks provided an extra boost. Airbnb bought back $1.1 billion in shares in the quarter. Diluted share count declined by 4.6% to 597 million. The move lifted EPS by 33%, outpacing the 27% increase in net income.
Risks: Net income for the second quarter reflected a $77 million tax benefit. Third-quarter performance is boosted by a three-point favourable currency effect. Marketing costs now account for 24.3% of revenue, with management anticipating continued margin pressure in the near term.
The share response reflects expectations beyond a straightforward beat. Investors require evidence that AI-driven savings will continue to support growth. The forecasted drop in third-quarter margins makes this proof urgent.