
NEW YORK, August 10, 2026, 12:11 EDT
- Through August 7, VXUS delivered a 15.99% return this year, while VTI rose by 14.59%.
- VXUS is valued at 18.3 times its portfolio’s earnings, while VTI stands at 27.0 times.
- An allocation matching global market weights would increase yearly fund expenses by roughly $76 for each $1 million invested. This figure is an initial estimate calculated from present expense ratios.
Vanguard Total International Stock ETF NASDAQ:VXUS has delivered stronger performance than Vanguard Morningstar Total Stock Market ETF NYSEARCA:VTI so far this year. VXUS recorded a NAV return of 15.99% as of Friday, while VTI posted a 14.59% return. Additionally, the portfolio earnings multiple for VXUS is 32% lower.
This is significant for retirement portfolios with heavy exposure to U.S. stocks. The top ten holdings in VXUS make up 14.43% of its assets, while VTI’s top ten holdings comprise 31.88%.
The lower price corresponds to slower fundamental growth. VXUS’s earnings growth rate stands at 12.6%, compared to 21.9% for VTI. Over the last decade, the U.S. fund has also outperformed by roughly 5.2 percentage points per year.
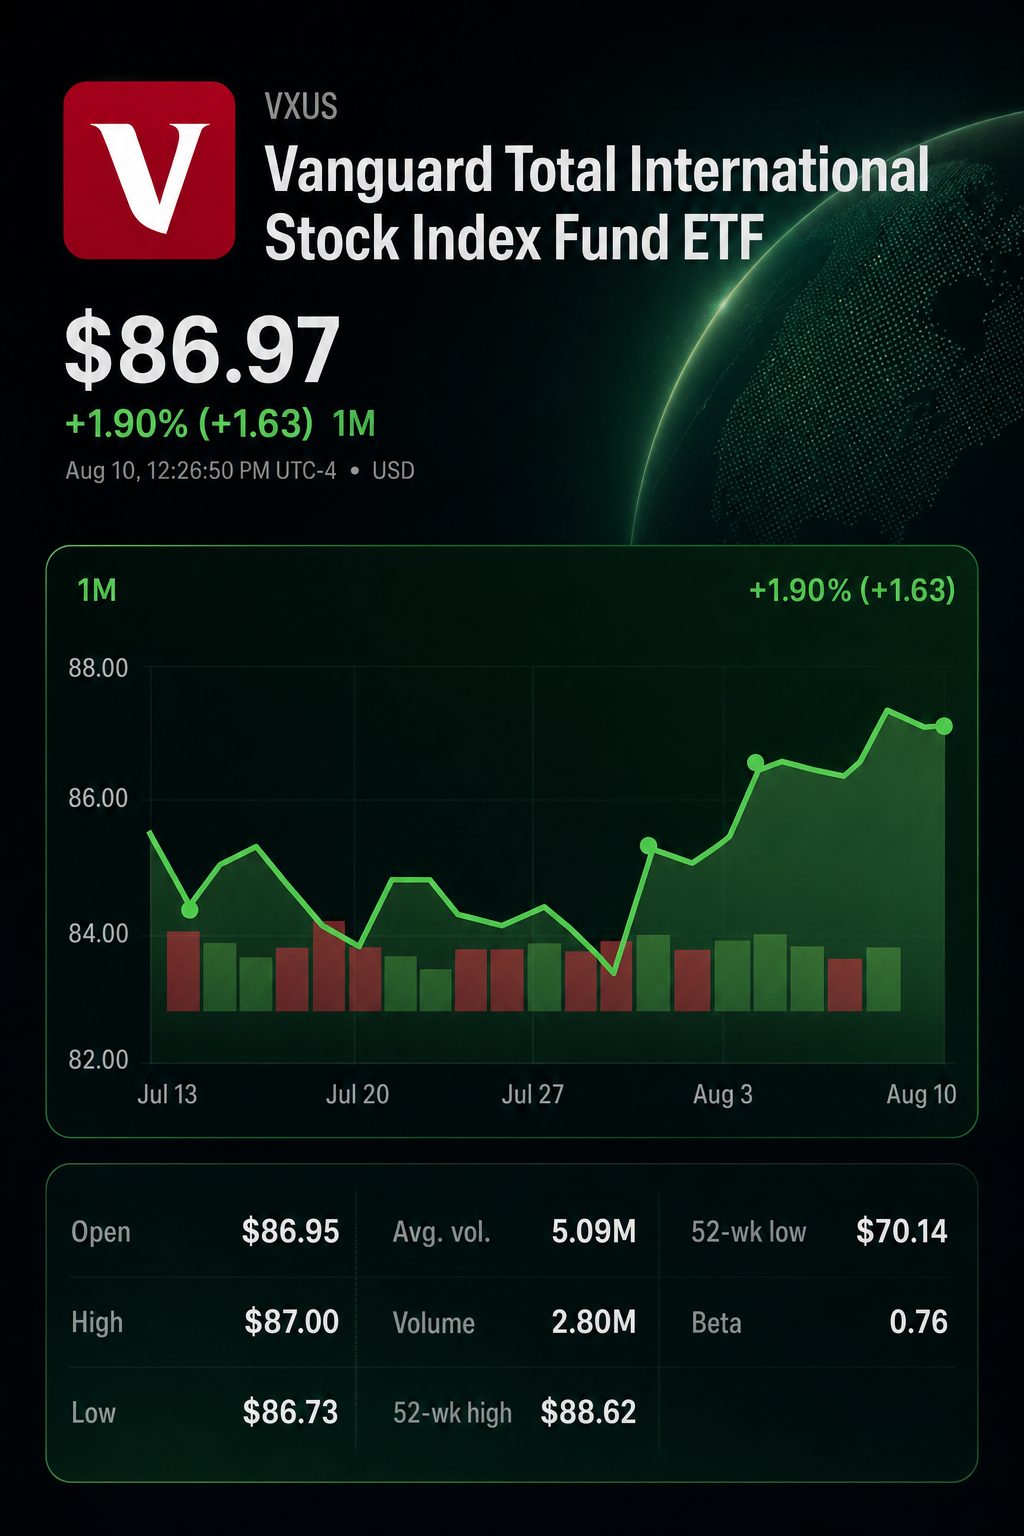
U.S. markets opened at the dateline. VXUS declined 0.29% to $86.96, while VTI edged up 0.10% to $382.17. Brent crude climbed past $86 as investors monitored tensions in Hormuz and anticipated Wednesday’s inflation data.
| Performance measure | VXUS | VTI | VXUS advantage |
|---|---|---|---|
| Monday closing price and change | $86.96, -0.29% | $382.17, +0.10% | — |
| NAV return through Aug. 7, 2026 | 15.99% | 14.59% | +1.40 points |
| 12-month NAV return through July 31 | 27.38% | 19.80% | +7.58 points |
| Annualized return over ten years | 9.38% | 14.53% | -5.15 points |
Intraday pricing was not current. Performance numbers factor in distributions where noted.
The outcome depends on the time frame. Over one year and in 2026, international stocks outperform. U.S. equities continue to lead across the decade.
Lumen Research, writing for Seeking Alpha, assigns a Buy rating to VXUS. The analyst anticipates “high-single-digit to low-double-digit returns” in the next six to 12 months, assuming international profits stay robust. The TipRanks comparison linked in the text describes VXUS and VTI as complementary exposures to different regions. Seeking Alpha
| Portfolio metric | VXUS | VTI |
|---|---|---|
| Management fee | 0.05% | 0.03% |
| Total holdings | 8,755 | 3,531 |
| Price-to-earnings ratio | 18.3x | 27.0x |
| Annualized earnings growth | 12.6% | 21.9% |
| Yield from dividends | 2.33% | 1.06% |
| Top 10 holdings weight | 14.43% | 31.88% |
Most fund attributes are as of June 30. Expense ratios reflect the most recent data from the prospectus.
VXUS offers a yield that is over double that of VTI. However, the U.S. portfolio shows an earnings growth rate superior by 9.3 points. Investors are placing a higher value on portfolios with stronger recent business results.
Released recommendations are favorable, though they assess varying aspects.
| Source and method | Instrument | Recommendation or signal | Supporting detail |
|---|---|---|---|
| Lumen Research, fundamental analysis | VXUS | Buy | Six-to-12-month return forecast is conditional |
| TipRanks holdings-weighted analyst model | VTI | Moderate Buy | 2,330 Buy, 1,072 Hold, and 67 Sell recommendations |
| TipRanks technical model | VXUS | Buy | Leading moving averages suggest Buy; RSI reads Neutral, MACD gives Sell |
The VTI recommendation does not come from an ETF analyst directly. TipRanks bases it on analyst ratings of the fund’s component stocks. The VXUS signal is generated by technical analysis, while the Lumen assessment is discretionary.
A strict either-or scenario may not be appropriate in this case. As of June 30, Vanguard Total World Stock ETF (NYSEARCA:VT) maintained 37.93% of its holdings outside the United States. This offers a neutral market-cap standard for pairing VTI with VXUS.
| Preliminary pro forma measure | 100% VTI | 62.07% VTI / 37.93% VXUS | 100% VXUS |
|---|---|---|---|
| Expense ratio | 0.0300% | 0.0376% | 0.0500% |
| Effective portfolio P/E | 27.0x | 22.9x | 18.3x |
| Dividend yield | 1.06% | 1.54% | 2.33% |
| Reconstructed top-ten concentration | 31.88% | around 20.4% | 14.43% |
| Annual fund cost per $1 million | $300 | approximately $376 | $500 |
The combined results are based on initial calculations. P/E is determined using weighted earnings yields. Concentration figures are derived from June 30 portfolio holdings, not accounting for trading activity, taxes or rebalancing.
The difference in fees is minimal. The combined allocation adds approximately $76 per year for each $1 million compared to VTI by itself. It also boosts the indicated dividend yield by around 45%.
The main adjustment affects portfolio structure. The blend reduces projected top-ten concentration by roughly 11.5 percentage points. Its effective P/E drops from 27.0 to around 22.9 times.
Valuation by itself does not serve as a timing instrument. Vanguard stated in July that valuations are unreliable indicators for forecasting short- or medium-term performance. Returns are influenced by earnings, dividends, and currency fluctuations as well.
Risks persist. VXUS introduces exposure to foreign currencies, geopolitical factors, and emerging markets. If the dollar strengthens, some of its recent outperformance could be undone. Meanwhile, VTI is exposed to different risks, including elevated valuations and more concentrated holdings.
The data does not indicate any lasting victor. Instead, it points to a balanced global allocation as preferable. Investors are able to significantly lower valuation and concentration risks with minimal extra fund expense.