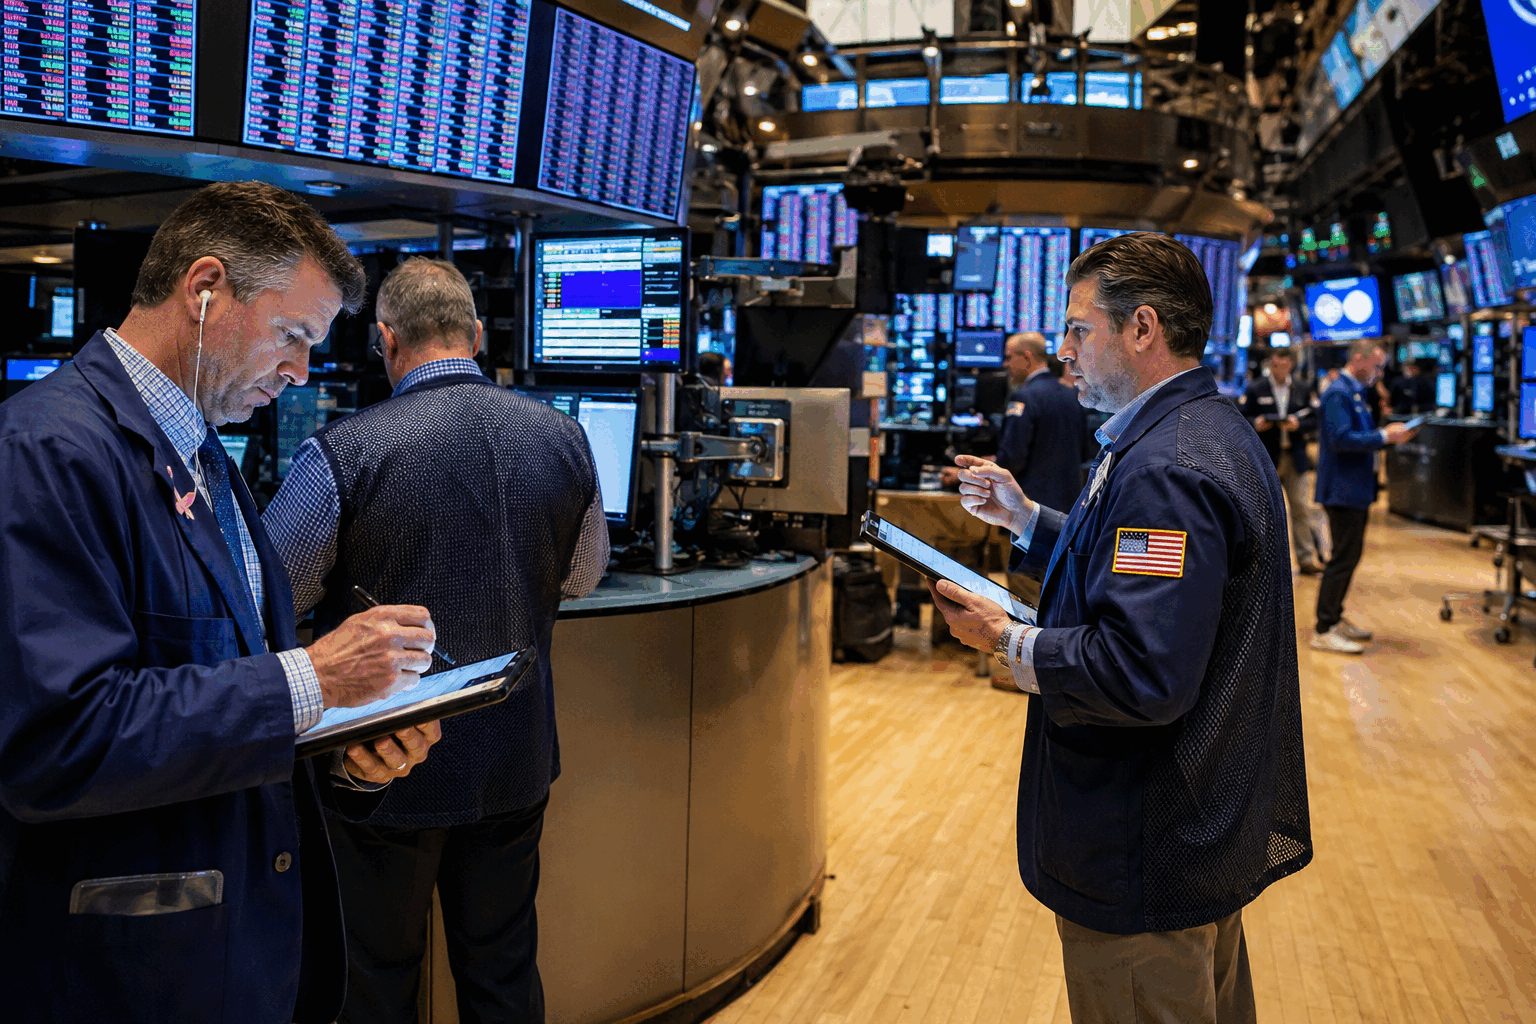

NEW YORK, August 10, 2026, 15:04 EDT — The S&P 500 (INDEXSP:.INX) edged down 0.11% to 7,749.24 late in the session, even as the average daily call-to-put ratio over the past month touched 0.9, marking its highest bullish level in at least four years.
- The S&P 500 advanced 5.8% over four sessions ending August 4.
- The surge surpassed the index’s total trading range from the previous three months.
- JPMorgan’s 8,000 target currently represents just a 3.2% potential gain compared with Monday’s close.
- The VIX gained 3.36% while all three major US indexes declined.
The division is significant. Investors are securing upside protection following rapid price moves. This can fuel a continued rally, but it also means fewer buyers remain afterward.
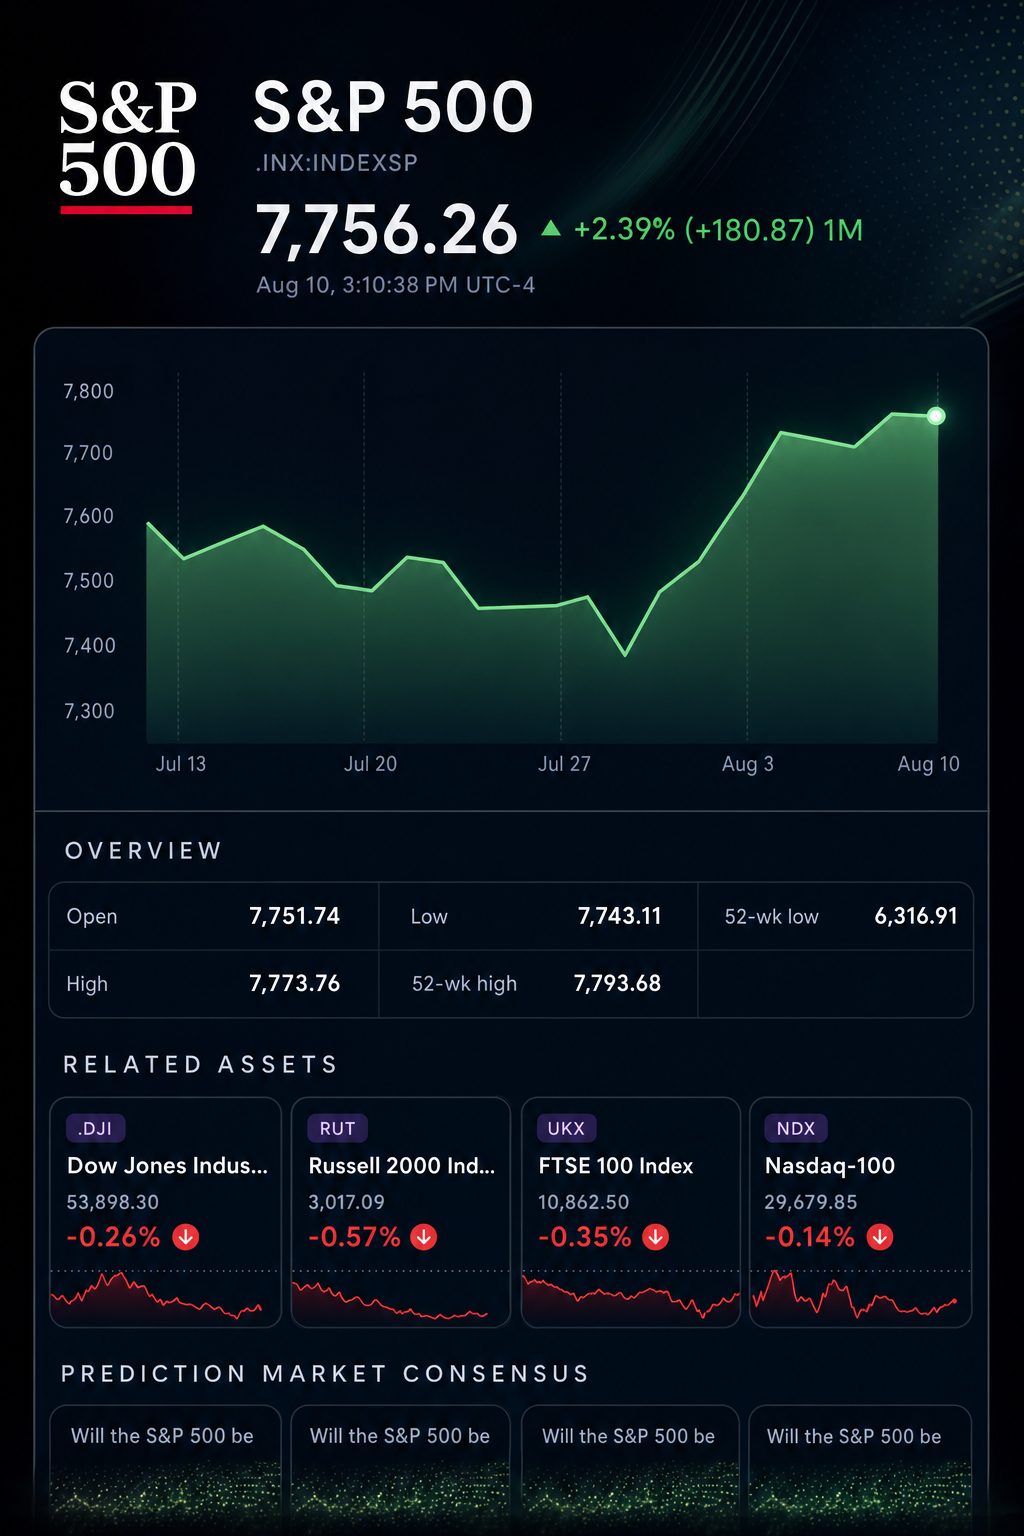
The S&P 500 rose 5.8% over four sessions through August 4. Prior to this rally, the index had remained within a 5.7% band for nearly three months. As a result, the latest four-day surge matched 102% of the previous quarter’s entire range.
| Late-session market | Level | Daily move | Snapshot time |
|---|---|---|---|
| S&P 500 (INDEXSP:.INX) | 7,749.24 | down 0.11% | 14:30 EDT |
| Dow Jones (INDEXDJX:.DJI) | 53,903.90 | off 0.25% | 14:55 EDT |
| Nasdaq Composite (INDEXNASDAQ:.IXIC) | 26,569.91 | falling 0.45% | 14:29 EDT |
| VIX (INDEXCBOE:VIX) | 15.40 | rising 3.36% | 14:26 EDT equivalent |
According to Google Finance, the S&P, Dow and Nasdaq all moved lower during the specified times. The VIX climbed even with the indexes down. This index reflects expected S&P 500 volatility based on option prices.
Monday saw a slight move in direction. The positioning, however, was significant.
| Rally structure | Observed move | Comparison | Calculated reading |
|---|---|---|---|
| Previous three-month S&P range | 5.7% | 20-year rolling average: 12.5% | Range was 54.4% tighter |
| Four trading days ended Aug. 4 | +5.8% | Previous range: 5.7% | Equal to 101.8% of total range |
| Session on Aug. 4 | S&P advanced nearly 2% | VIX climbed nearly 1 point | Both shares and volatility gained |
The previous range was 54.4% tighter compared to the 12.5% average going back to 2006. After this period of compression, the market surged upward in just four sessions. This rapid move is a key reason underexposed investors opted to purchase calls instead of holding out for a dip.
“There are several factors, but FOMO is a part of it,” Nationwide chief market strategist Mark Hackett said. Reuters
| Positioning measure | Latest signal | Historical context | Interpretation |
|---|---|---|---|
| S&P call-to-put ratio | 0.9 one-month average | Most bullish range observed in at least four years | Significant appetite for upside exposure |
| Short-term S&P call skew | Increased sharply over the past week | Highest level in two years | Participants paid a premium for quick upside |
| Bullish Percent Index | Above 70% | Exceeds the overbought line | Widespread rally, but market breadth appears extended |
Trade Alert data was used by Reuters to calculate the call-to-put ratio. Susquehanna Financial Group tracked the call-skew peak spanning two years. The over-70% breadth figure was highlighted by Adam Turnquist at LPL Financial Holdings NASDAQ:LPLA.
Call options grant buyers the right to buy at a set price. When the call-to-put ratio is elevated, it indicates greater demand for upward exposure rather than protective downside bets. Call skew reflects the premium investors pay for upside potential compared to downside protection.
Steve Sosnick, chief strategist at Interactive Brokers Group NASDAQ:IBKR, commented: “FOMO never left. It just wasn’t in the forefront of the market.” Reuters
| Wall Street forecast | 2026 S&P 500 target | Upside from 7,749.24 | Forecast date |
|---|---|---|---|
| RBC Capital Markets, Royal Bank of Canada NYSE:RY | 7,900 | 1.9% | May 8 |
| JPMorgan Chase & Co. NYSE:JPM | 8,000 | 3.2% | Aug. 10 |
| Citigroup Inc. NYSE:C | 8,100 | 4.5% | June 8 |
The forecast table reflects each bank’s stated 2026 target alongside the S&P level as of Monday. On Monday, JPMorgan boosted its projection to 8,000 from 7,800. RBC and Citigroup previously set targets at 7,900 and 8,100, respectively.
The contrast is clear. The 5.8% advance over four days surpassed the leftover gains needed to meet all three objectives. Investors purchasing calls at this stage may be hedging against the index lagging, rather than predicting a similar surge.
Underlying factors remain supportive. JPMorgan lifted its S&P earnings forecast for 2026 to $365 from $350, and increased its projection for 2027 to $420 from $390. The bank maintained its forward price-to-earnings multiple estimate around 20.
The main threat is a crowded exit. An uptick in inflation, fresh oil market strain, or disappointing earnings could prompt call buyers to exit their positions. As the Bullish Percent Index stands above 70%, any drop in market breadth would increase reliance on a handful of large-cap stocks.
Trading on the NYSE was still underway as of the dateline. The main session concludes at 16:00 EDT.
The upcoming July consumer price data due Wednesday will be the next key indicator. According to a Reuters poll of economists, annual inflation is projected at 3.4%, easing from 3.5% in June. Should the figure exceed expectations, it will challenge whether robust four-year demand for bullish options is sustainable or simply a sign of late-cycle buying.
Related articles: NYSE:JPM