
NEW YORK, August 14, 2026, 05:23 EDT — U.S. cash markets were closed. Premarket trading was active.
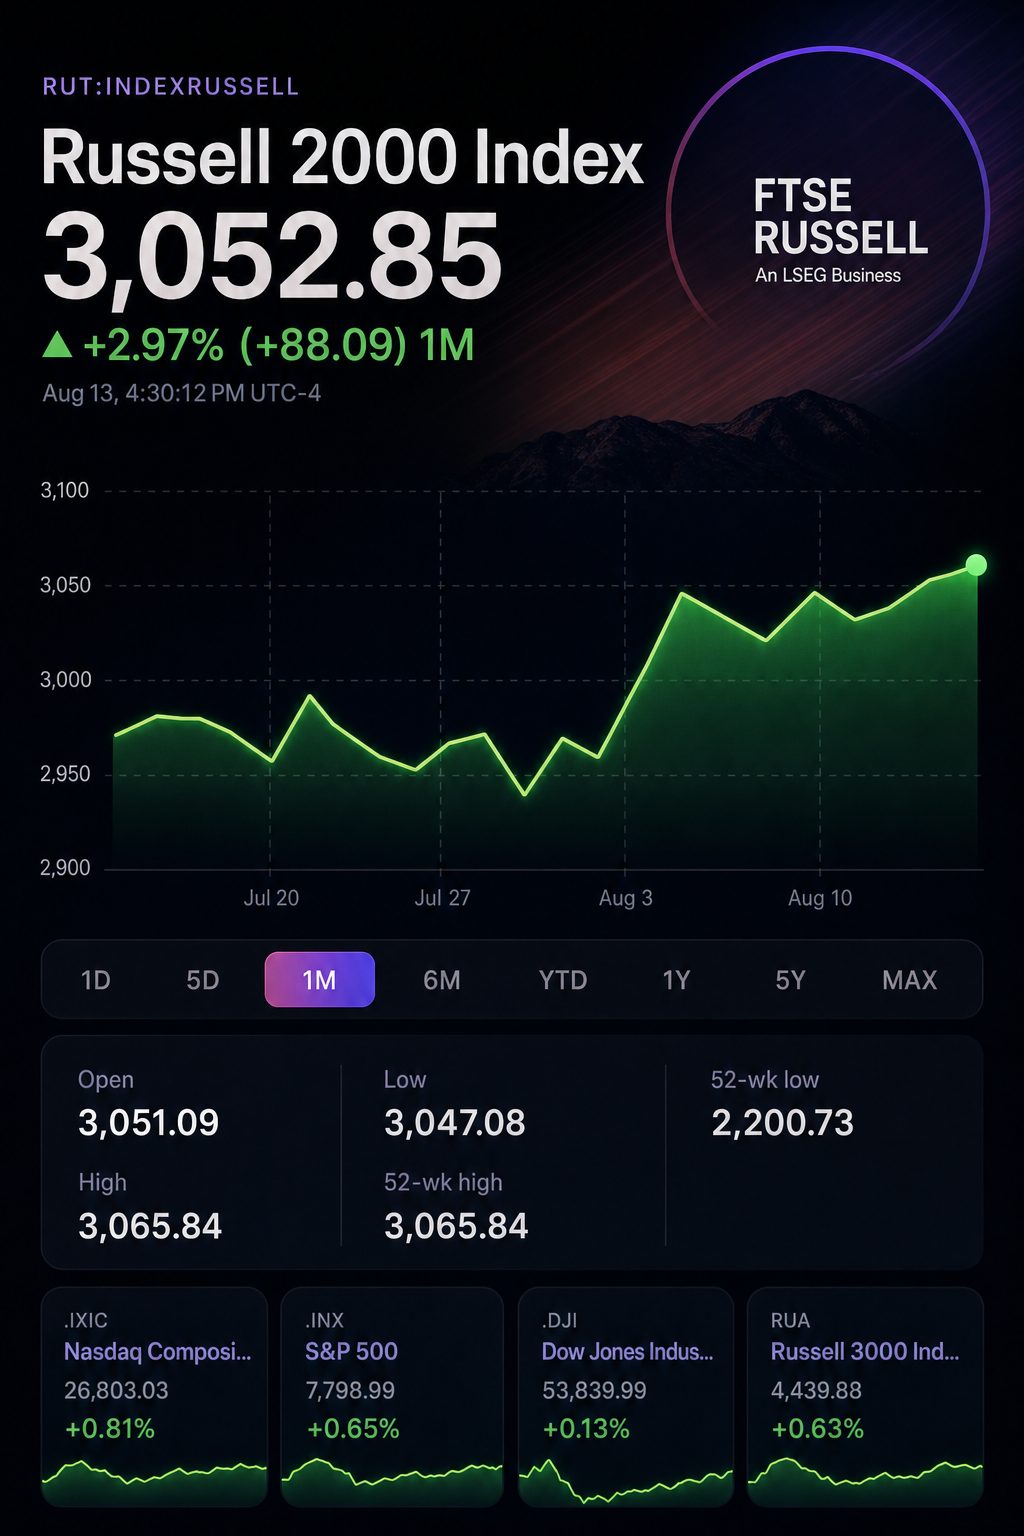
The Russell 2000 closed at a record 3,052.85 on Thursday. Its 23% 2026 gain leads the S&P 500 by 9.1 percentage points. Yet its main exchange-traded proxy still trades at a 34.5% earnings-multiple discount to large caps.
That gap is the investor test. Small-cap leadership has come from cheaper breadth, not a large-cap valuation. It also carries more rate sensitivity and economic risk.
Early Friday, Dow futures fell 0.2%. S&P 500 futures were flat, while Nasdaq-100 futures added 0.1%. The 10-year Treasury yield rose two basis points to 4.67%.
| U.S. index | Thursday move | Week to date | 2026 to date |
|---|---|---|---|
| Russell 2000 | +0.2% | +0.6% | +23.0% |
| Nasdaq Composite | +0.8% | +0.4% | +15.3% |
| S&P 500 | +0.7% | +0.5% | +13.9% |
| Dow Jones Industrial Average | +0.1% | -0.4% | +12.0% |
Thursday’s producer-price report strengthened the rate case for small caps. July prices were unchanged from June. The annual pace slowed to 4.7% from 5.5%. Markets cut the implied chance of a September Fed increase to 35% from 55% one week earlier.
SPI Asset Management strategist Stephen Innes said, “The disinflation ducks are starting to line up.” Oil has since rebounded, keeping the rate signal unsettled. Associated Press
| Fund measure | iShares Russell 2000 ETF NYSEARCA:IWM | iShares Russell 1000 ETF NYSEARCA:IWB | Small-cap difference |
|---|---|---|---|
| Portfolio P/E | 19.21x | 29.32x | 34.5% discount |
| Portfolio price-to-book | 2.17x | 5.20x | 58.3% discount |
| Three-year beta | 1.27 | 1.01 | 25.7% higher |
| Three-year standard deviation | 19.98% | 13.20% | 51.4% higher |
| Number of holdings | 1,967 | 1,023 | 944 more |
The discount is real, but not free. IWM’s beta is 25.7% above IWB’s. Its three-year volatility is 51.4% higher. Those calculations use BlackRock’s July 29 portfolio data.
Sector mix explains much of that trade-off. Health care and financials form 39.86% of IWM. They represent 22.62% of IWB. Technology carries the opposite gap.
| Sector | IWM weight | IWB weight | IWM minus IWB |
|---|---|---|---|
| Health care | 20.08% | 9.72% | +10.36 points |
| Financials | 19.78% | 12.90% | +6.88 points |
| Industrials | 14.06% | 9.80% | +4.26 points |
| Information technology | 12.35% | 33.94% | -21.59 points |
The fund’s largest positions remain small. BrightSpring Health Services (NASDAQ:BTSG) held a 0.37% weight. Moog Inc. Class A NYSE:MOG.A and UMB Financial Corp. (NASDAQ:UMBF) each held about 0.36%.
| Top IWM holding | Buy | Hold | Sell | Average target | Implied upside |
|---|---|---|---|---|---|
| BrightSpring Health (NASDAQ:BTSG) | 14 | 0 | 0 | $79.85 | 32.58% |
| Moog Class A NYSE:MOG.A | 3 | 0 | 0 | $462.33 | 8.23% |
| UMB Financial (NASDAQ:UMBF) | 9 | 2 | 0 | $167.00 | 10.68% |
Analysts favor all three, but target dispersion is wide. BrightSpring carries the highest consensus upside. Moog’s average target offers only 8.23%, despite three buy ratings.
Friday’s July retail-sales release is the next test. June sales rose 0.2% to $768.6 billion. The July estimate is preliminary and due at 08:30 EDT. Strong demand could aid earnings but revive rate pressure.
Risks: Higher oil, stronger yields or weak consumer demand could hit small caps harder. Their valuation discount may persist because leverage, refinancing needs and cyclical exposure exceed large-cap levels.