
NEW YORK, August 3, 2026, 12:12 EDT New York Stock Exchange
- Vanguard Morningstar Total Stock Market ETF NYSEARCA:VTI rose 1.32% to $373.06, trading 1.11% under a model-based breakout threshold of $377.20.
- A drop back to the model’s $363.93 long-entry support reflects a move of 2.45%. This is 2.2 times the size of the residual breakout gap.
- Small-cap stocks led gains, with the iShares Russell 2000 ETF NYSEARCA:IWM advancing 1.61%.
VTI gained 1.32% to reach $373.06 in midday trading on Monday, while NYSE Arca’s main trading hours continued.
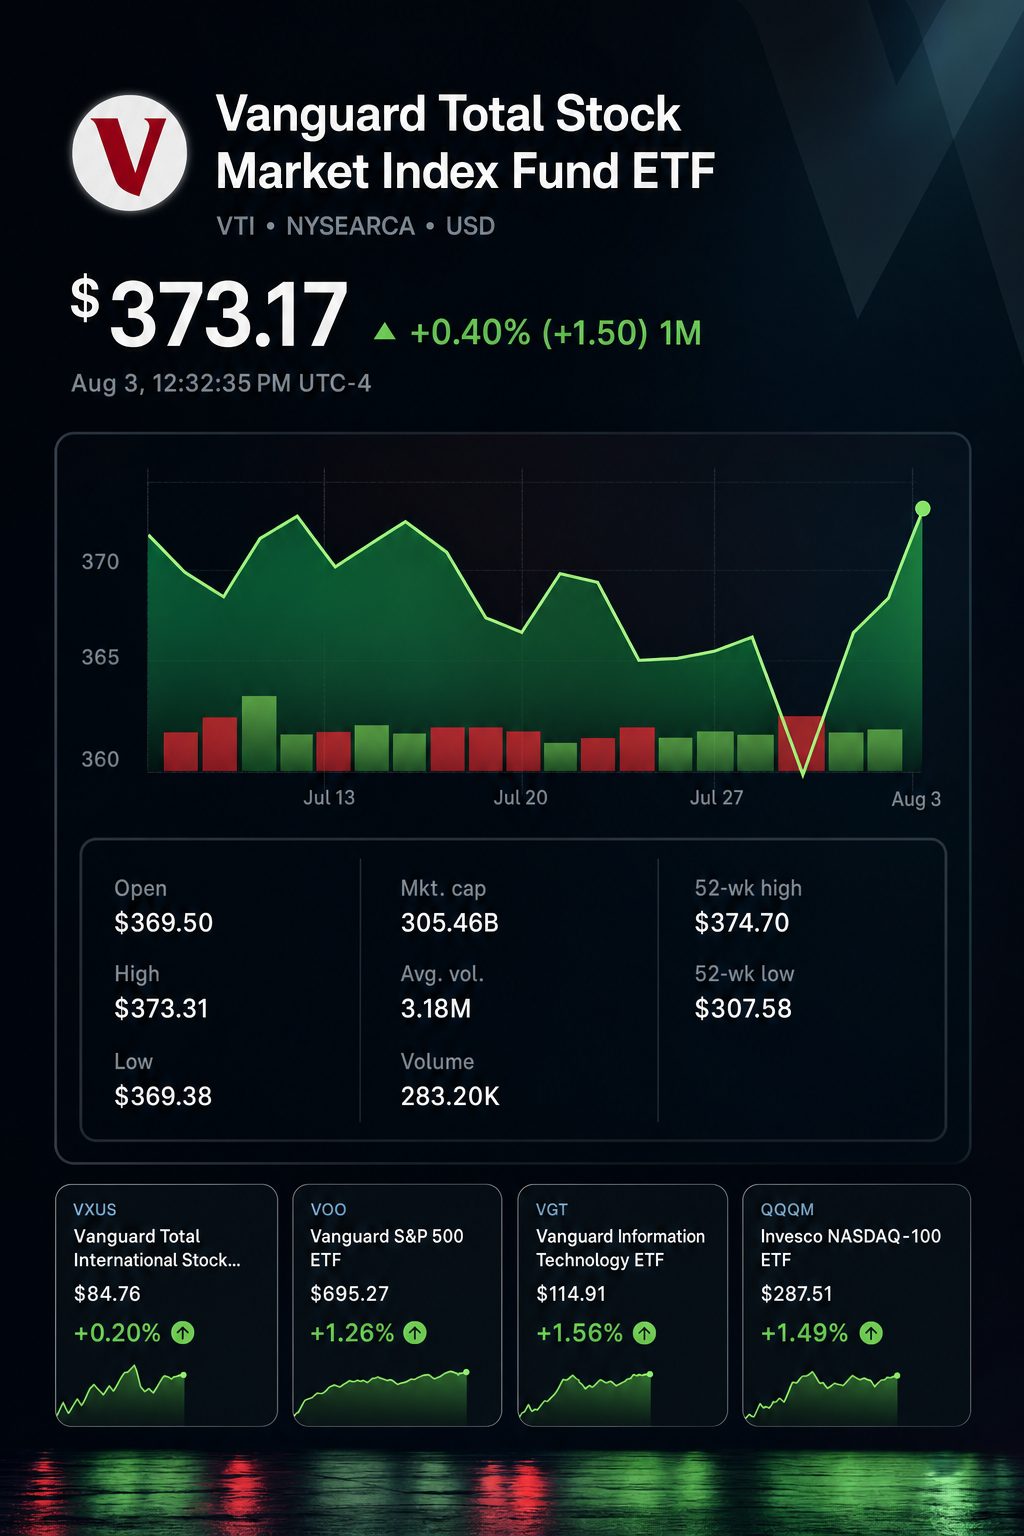
The advance put VTI 1.11% under Stock Traders Daily’s breakout threshold of $377.20. The long-entry support identified by the firm was 2.45% beneath, at $363.93.
This results in a 2.2-to-1 gap between downside and breakout. Timing entries has now become more important than the general Buy ratings.
Intraday figures are subject to change as prices may fluctuate rapidly.
| Reference | Level | Gap from $373.06 | Model role |
|---|---|---|---|
| Mid-term support | $361.66 | -3.06% | Support for five to 20 days |
| Long-entry support | $363.93 | -2.45% | Position trade entry point |
| Near-term support | $364.41 | -2.32% | Support for one to five days |
| Resistance and trigger | $377.20 | +1.11% | Long target, breakout level, and short entry |
| Breakout target | $384.74 | +3.13% | Target for momentum moves |
| Short target | $358.34 | -3.95% | Hedge target |
Stock Traders Daily’s 10:10 a.m. report provides the levels. Gaps are calculated using the 11:56 a.m. quote for VTI.
Caution is advised regarding the model’s headline short ratio. The shown entry, target, and stop suggest approximately 16.7-to-1 prior to any undisclosed modifications. The summary lists a 12.2-to-1 ratio. The target displayed is 5.0% under entry, compared to 3.5% referenced in the summary.
The connected reports diverge primarily regarding their timeframes.
| Source or measure | Horizon | Published reading |
|---|---|---|
| Stock Traders Daily | One to five days | Neutral |
| Stock Traders Daily | Five to 20 days | Neutral |
| Stock Traders Daily | Beyond 20 days | Strong |
| TipRanks moving averages | Overall technical outlook | Buy; nine bullish, three bearish |
| TipRanks oscillators | Momentum | Strong Sell |
| TipRanks rate of change | Momentum | -1.72 |
The Stock Traders Daily report came out on Monday, while TipRanks released its review on Friday.
The divide is well-known. Trend indicators stay positive even as momentum signals ease.
Monday’s session further strengthened the breakout case.
| Listed fund | Market segment | Midday move |
|---|---|---|
| iShares Russell 2000 ETF NYSEARCA:IWM | Small caps | +1.61% |
| Invesco QQQ Trust NASDAQ:QQQ | Nasdaq growth | +1.38% |
| VTI | Total U.S. market | +1.32% |
| iShares Core S&P Total U.S. Stock Market ETF (NYSEARCA:ITOT) | Total U.S. market | +1.26% |
| Vanguard S&P 500 ETF NYSEARCA:VOO | Large caps | +1.22% |
| Schwab U.S. Broad Market ETF (NYSEARCA:SCHB) | Broad U.S. market | +1.21% |
Prices are based on transactions logged from 11:56 to 11:57 a.m. EDT.
Advancing stocks on the NYSE led decliners by a ratio of 1.89-to-1 just after the market opened. Crude oil prices dropped significantly, with seven S&P 500 sectors posting gains.
VTI offers broad exposure by number of holdings but is heavily weighted at the top. At the end of March, ten stocks made up 33.4% of assets, despite accounting for just 0.29% of the 3,507 securities in the fund.
The nearest full-market competitors are almost identical in terms of fees.
| Total-market fund | Expense ratio | Holdings | Reported net assets | Monday move |
|---|---|---|---|---|
| VTI | 0.03% | 3,494 | $660.25 billion | +1.32% |
| ITOT | 0.03% | 2,448 | $94.34 billion | +1.26% |
| SCHB | 0.03% | 2,356 | $43.26 billion | +1.21% |
Data on VTI holdings and assets is sourced from TipRanks’ review as of July 31. Figures for ITOT and SCHB are provided by their respective issuers.
VTI holds assets over 15 times greater than SCHB. On Monday, the funds moved within just 0.10 percentage point of each other. In this trade, timing is more crucial than choosing between the funds.
The fund adopted its present official name on July 29. Vanguard stated that its management and objectives remain the same.
TipRanks sets a target of $445.61, representing a 19.4% increase from midday levels. This number reflects a weighted average of analyst ratings on the ETF’s component holdings, rather than a direct sell-side target on the ETF itself.
Macro events remain able to outweigh technical indicators. Chris Larkin, representing E*TRADE from Morgan Stanley NYSE:MS, stated that bulls this week would look to earnings and jobs data to “have to do the heavy lifting for the bulls this week.” Reuters
Risks: If there is an unsuccessful attempt to rise above $377.20, attention may shift back to the $363.93 support level. Shifts in geopolitics, oil prices, and Friday’s jobs data could rapidly disrupt these technical indicators.
The upcoming test is limited in scope. For any move above $377.20 to hold, broader participation is necessary. If not, the existing 2.2-to-1 disparity suggests waiting is prudent.




![Australia Stock Market Today 24/08/2026 [UPDATE: 10:38 AEST] [Miners Lift ASX as Banks Blunt Opening Gain]](https://ts2.tech/wp-content/uploads/2026/08/AU-market-dashboard-2026-08-24-1038-480x384.jpg "Australia Stock Market Today 24/08/2026 [UPDATE: 10:38 AEST] [Miners Lift ASX as Banks Blunt Opening Gain]")

![Asia Stock Market Today 24/08/2026 [UPDATE: 09:01 SGT] [Samsung Slides as SK hynix Splits Seoul Chip Trade]](https://ts2.tech/wp-content/uploads/2026/08/Asia-market-dashboard-2026-08-24-0859-480x384.jpg "Asia Stock Market Today 24/08/2026 [UPDATE: 09:01 SGT] [Samsung Slides as SK hynix Splits Seoul Chip Trade]")