
PITTSBURGH, August 18, 2026, 2:30 p.m. EDT — Trading was underway on U.S. exchanges.
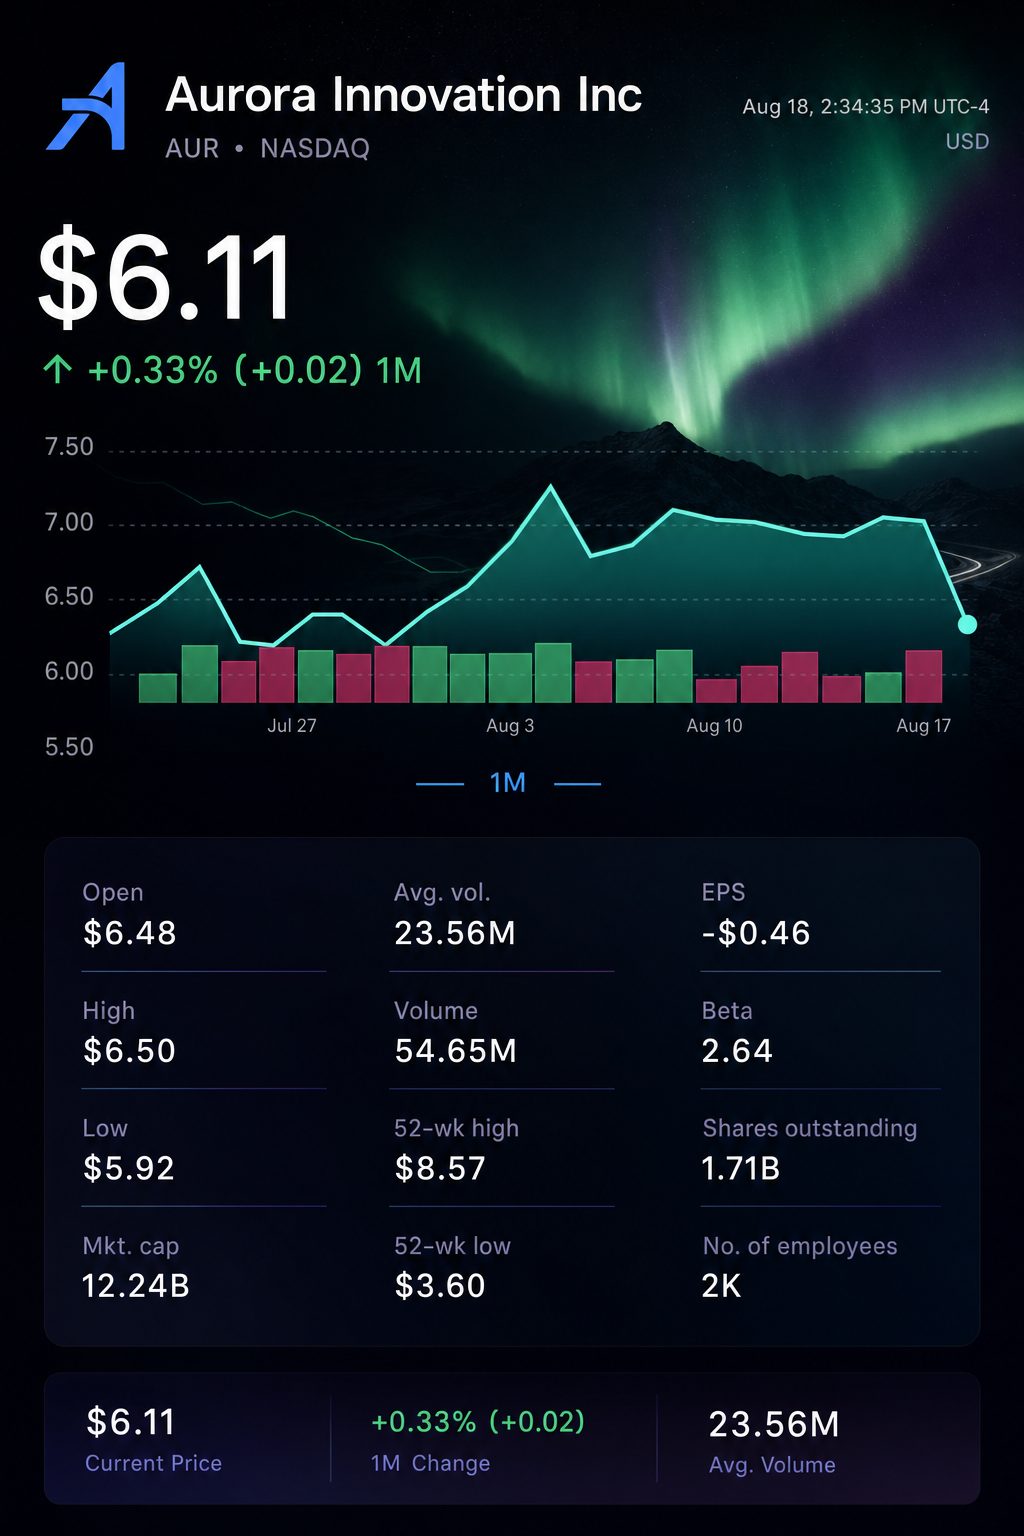
- Aurora stock dropped 12.1% to $6.12, with trading volume reaching 2.1 times the usual level.
- Index Ventures led two Form 144 filings for a total of 2.84 million shares.
- The $12.28 billion valuation continues to depend on a swift revenue increase by 2027.
Aurora Innovation, Inc. NASDAQ:AUR fell 12.1% to $6.12 as of 1:45 p.m. EDT on Tuesday. Volume was 49.58 million shares, exceeding double its recent average. The decline followed two planned-sale filings submitted Monday, coinciding with a broader selloff in technology stocks.
Index Ventures Growth III has registered to offer around 2.80 million Class A shares, with the total value estimated at $19.57 million. Separately, Yucca (Jersey) SLP filed for the potential sale of 42,639 shares estimated to be worth approximately $298,000. Form 144 serves as a notice of proposed sales and does not confirm that all shares have been sold.
| August 17 sale notice | Proposed shares | Filed market value | Share of Class A outstanding |
|---|---|---|---|
| Index Ventures Growth III | 2,800,043 | $19.57 million | 0.164% |
| Yucca (Jersey) SLP | 42,639 | $0.30 million | 0.002% |
| Total | 2,842,682 | $19.87 million | 0.166% |
The suggested block made up roughly 5.7% of Tuesday’s trading volume at the indicated time, but accounted for under 0.2% of Class A shares. The disparity indicates that while the reported supply may have had some marginal impact, valuation and market risk were more significant factors.
| Trading measure | August 18 reading | Investor context |
|---|---|---|
| Share price | $6.12 | Fell 12.12% |
| Intraday range | $5.92–$6.50 | Shares moved near the day’s lowest point |
| Volume | 49.58 million | 2.10 times above 23.56 million average |
| Market capitalization | $12.28 billion | 10.1 times June cash and short-term reserves |
| 52-week range | $3.60–$8.56 | 28.5% under the 52-week peak |
Rising bond yields also weighed on long-duration growth investments. The S&P 500 technology sector declined 2.1%, and the Philadelphia semiconductor index dropped 5.4%. The yield on the 30-year Treasury reached its highest point since 2007.
Aurora’s valuation overshadows its modest revenue. Revenue in the second quarter rose 100% to $2 million, while cost of revenue climbed to $7 million. Research expenses totaled $211 million. The operating loss grew by 16% to $266 million.
| Q2 measure | 2026 | 2025 | Change |
|---|---|---|---|
| Revenue | $2 million | $1 million | up 100% |
| Cost of revenue | $7 million | $5 million | increase of 40% |
| Research and development | $211 million | $190 million | up 11% |
| Operating loss | $266 million | $230 million | rises by 16% |
| Net loss | $270 million | $201 million | jumps 34% |
The balance sheet provides a financial cushion. As of June 30, Aurora reported $136 million in cash and $1.081 billion in short-term investments. Operating activities consumed $384 million in cash in the first half, with $56 million spent on equipment acquisitions.
An initial, basic assessment of runway is roughly 1.4 years. This figure annualizes cash used in operations and equipment spending from the first half, comparing the resulting $880 million rate to $1.217 billion in available liquidity. The real runway could vary significantly as factors such as truck rollout, changes in working capital and financing evolve.
| Funding measure | Amount | Why it matters |
|---|---|---|
| Cash and short-term holdings | $1.217 billion | Main liquidity as of June 30 |
| Cash used in the first half | $384 million | Increased $98 million from a year before |
| Equipment outlays in first half | $56 million | Roughly quadruple the amount seen last year |
| Proceeds from common stock in first half | $247 million | Indicates continued dependence on issuing equity |
| Basic estimated runway | About 1.4 years | Based on the current first-half cash burn rate |
Dilution is already factored in. Aurora issued 33 million Class A shares via its at-the-market program in the first half, raising net proceeds of $229 million. The number of outstanding Class A shares increased to 1.702 billion from 1.625 billion at the end of the year, with some of the rise offset by conversions from Class B shares.
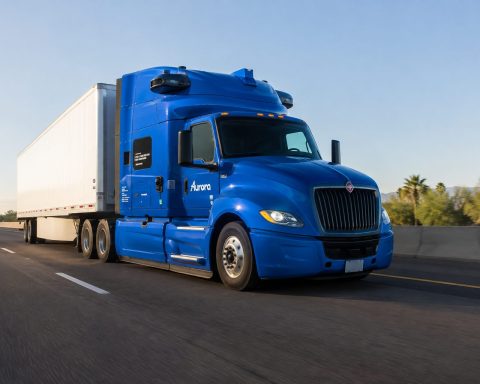
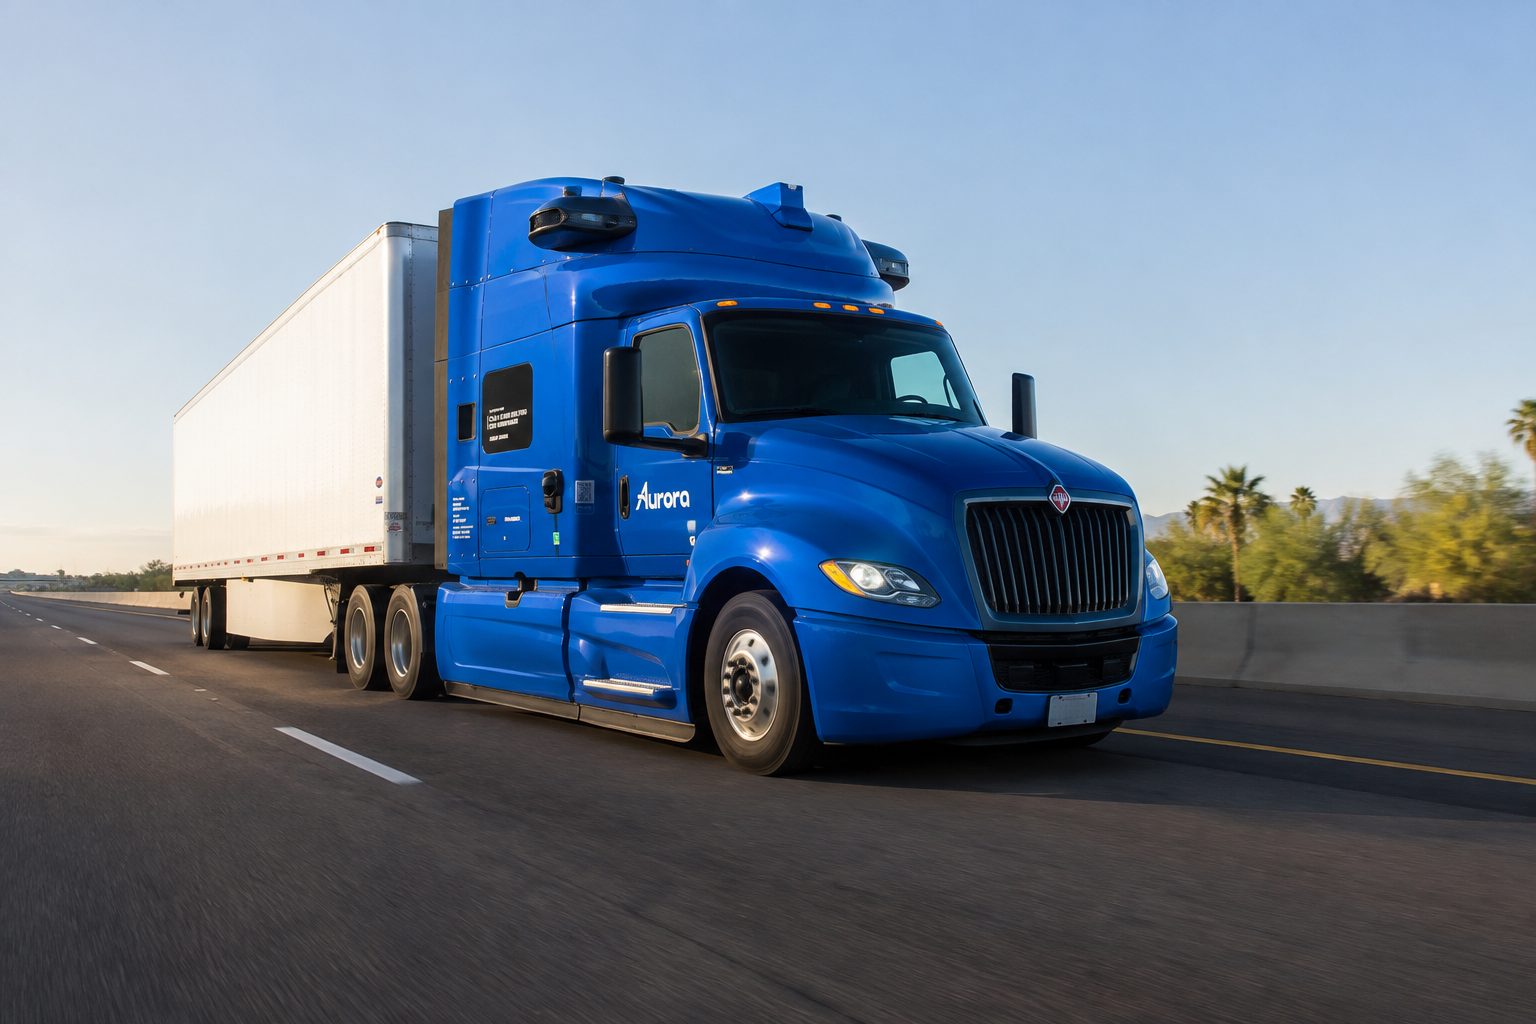
More significance is now placed on execution compared to sale announcements. Aurora stated that its latest generation of hardware will be priced at 50% less than the previous system. Manufacturing partner Roush is projected to achieve a 1,000-truck yearly production rate in October. Aurora maintains its commitment to have 200 driverless trucks deployed by the end of 2026.
Aurora CEO Chris Urmson stated the company is “positioned to put hundreds of driverless trucks on the road this year.” Aurora logged close to 440,000 autonomous miles through June, operating on 10 routes in the Sun Belt region. Aurora fleet update
| Analyst | Recommendation | Price target | Date |
|---|---|---|---|
| Michael Latimore | Buy, rating repeated | $11 | July 30 |
| Chris McNally | Hold, rating unchanged | $8 | July 30 |
| George Gianarikas | Buy, rating unchanged | $15 | July 29 |
| Ravi Shanker | Buy, rating unchanged | $14 | July 30 |
| Andres Sheppard | Buy, rating repeated | $12 | July 30 |
| Itay Michaeli | Hold, rating unchanged | $7 | July 30 |
| Chris Pierce | Buy, rating repeated | $13 | July 30 |
Analysts maintain an overall positive outlook. Out of eight most recent ratings, six are buys, while two are holds; there are no sell ratings. The group’s average target price stands at $11.43, suggesting an 86.6% upside from $6.12. Given an unchanged share count, this target would equate to about $22.9 billion in market capitalization.
| Valuation bridge | Estimate |
|---|---|
| Market capitalization now | $12.28 billion |
| Q2 revenue, annualized | $8 million |
| Market capitalization to annualized Q2 revenue | Roughly 1,535× |
| Consensus analyst target market capitalization | Roughly $22.9 billion |
| Incremental value implied by target | Roughly $10.6 billion |
The gap serves as a test for investors. The year-end aim of 200 trucks needs to generate fee-per-mile revenue quickly to help close the valuation gap. The management’s retail investor town hall on August 20 is the next planned opportunity to clarify how this will be achieved.
Risks: Delays in deployment, safety events, cancellations by customers, or a slower pace of fee-per-mile adoption may increase losses. Additional equity offerings could dilute existing shareholders. Quicker fleet expansion and decreased hardware expenses could lead to better results.