NEW YORK, August 19, 2026, 06:37 EDT — U.S. stock markets are currently trading before the opening bell.
CME Group Inc. NASDAQ:CME faces a new currency driver as trading begins on Wednesday. According to a MillTech survey published Tuesday, 94% of North American fund managers are now using foreign-exchange hedges, the largest proportion seen in at least four years.
CME’s institutional FX network is already experiencing an uptick. In July, average daily notional volume on EBS Spot FX climbed by 25% year-on-year, reaching $70 billion. FX Link saw a 38% gain in volume.
However, currency futures still account for only a minor portion of CME’s total listed activity. FX contracts made up roughly 3% of the record 27 million daily contracts traded in July. Interest-rate and equity-index instruments contributed a combined 77%. As a result, the developing FX trend has limited impact on earnings, but maintains the potential for gains should currency volatility broaden.
| July 2026 product group | Average daily volume | Share of CME total |
|---|---|---|
| Interest rates | 12.6 million | 46.7% |
| Equity indexes | 8.2 million | 30.4% |
| Foreign exchange | 811,000 | 3.0% |
| Other products | 5.4 million | 20.0% |
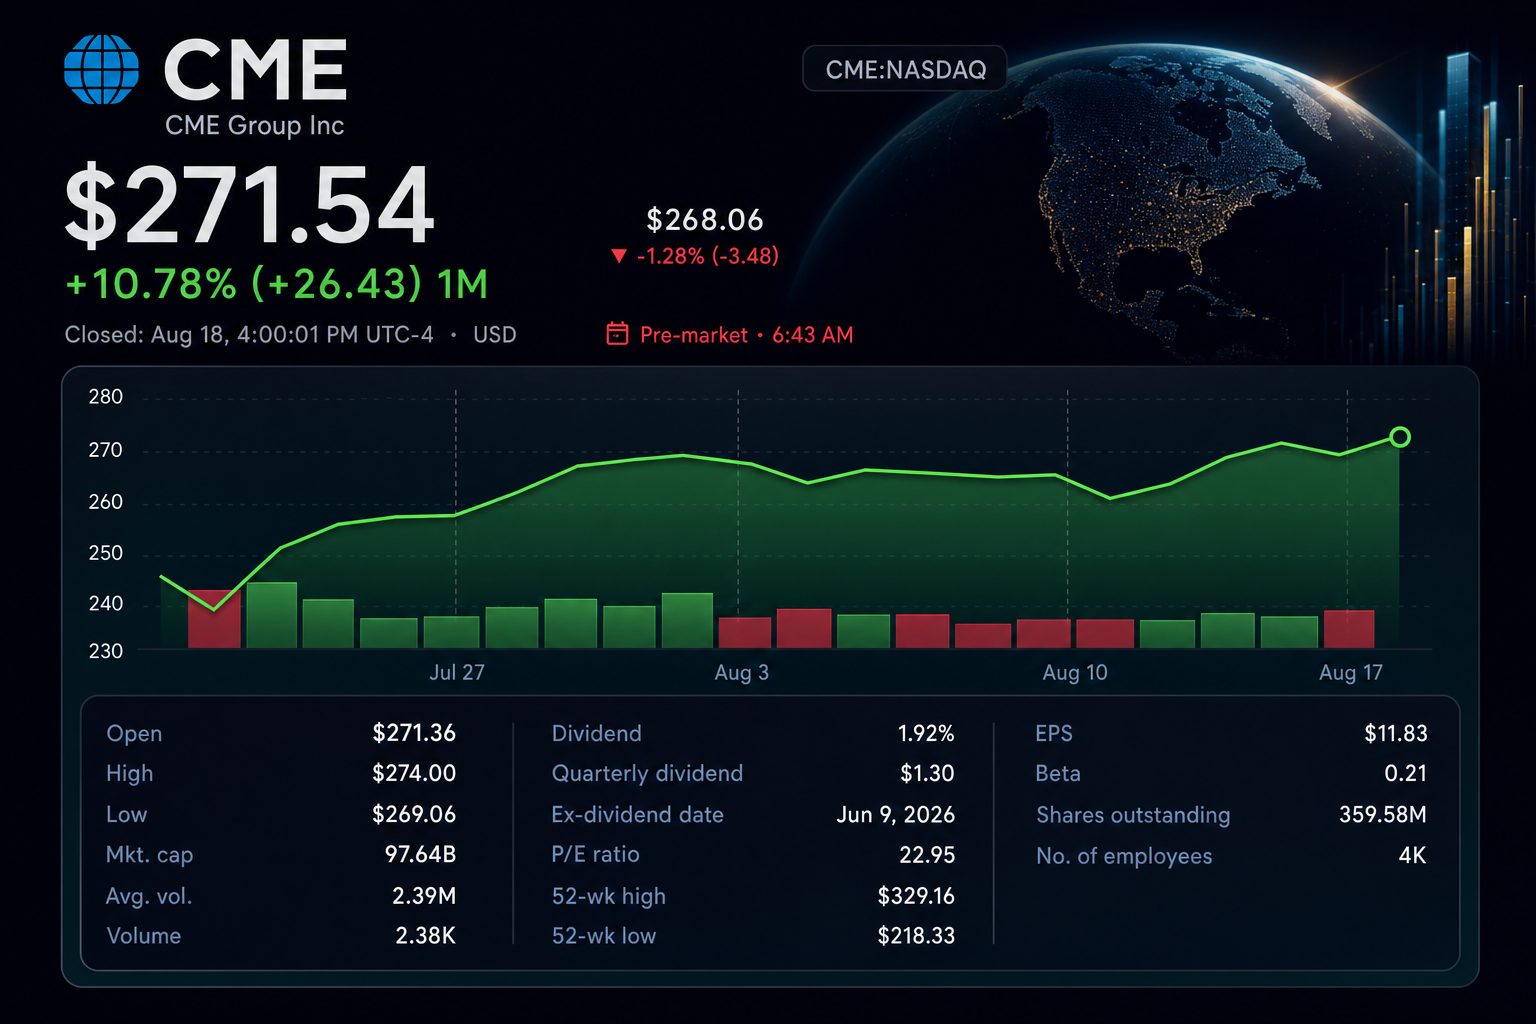
The stock gained 1.37%, reaching $271.54 on Tuesday. This was stronger than the S&P 500’s 0.69% drop. Still, trading volume came in at roughly half the 50-day average, which muted the signal.
| Exchange operator | August 18 move | Close |
|---|---|---|
| CME Group NASDAQ:CME | up 1.37% | $271.54 |
| Intercontinental Exchange NYSE:ICE | gained 1.21% | $156.18 |
| Nasdaq Inc. NASDAQ:NDAQ | added 0.03% | Not reported |
| Cboe Global Markets (BATS:CBOE) | fell 1.36% | $290.99 |
| S&P 500 | down 0.69% | — |
CME’s second-quarter earnings highlighted the significance of volume mix. Overall revenue increased by 0.8%, even as clearing and transaction fees fell 2.6%. A 20.2% rise in market-data revenue made up the majority of the shortfall.
| Second-quarter revenue | Q2 2026 | Q2 2025 | Year-on-year |
|---|---|---|---|
| Total revenue | $1.706 billion | $1.692 billion | +0.8% |
| Clearing and transaction fees | $1.353 billion | $1.388 billion | -2.6% |
| Market data and information services | $238.1 million | $198.1 million | +20.2% |
| Other revenue | $115.6 million | $105.9 million | +9.2% |
Adjusted earnings came in at $2.99 per share, surpassing the analyst consensus of $2.91 cited by Reuters. The average daily volume for the second quarter was 29.8 million contracts, marking the third-largest quarterly figure.
Chief Executive Terry Duffy stated that “The first half of 2026 was the strongest in CME Group’s history.” CME distributed $1.16 billion via dividends and share buybacks in the quarter. Company statement
July figures kept the momentum going. Total daily volume increased by 23% year-on-year. International volume advanced 32% to 8.8 million contracts, driving growth outside U.S. trading hours.
Analysts maintain a positive outlook, though the projected return is limited as of Tuesday’s close. The consensus target stands at $283.93, representing a 4.6% premium over $271.54. Price targets continue to vary broadly, spanning $230 to $330.
| Analyst measure | Value | Implied move from $271.54 |
|---|---|---|
| Consensus rating | Buy | — |
| Lowest target | $230 | -15.3% |
| Mean target | $283.93 | +4.6% |
| Median target | $286 | +5.3% |
| Highest target | $330 | +21.5% |
CME is set to distribute a $1.30 quarterly dividend on September 25. Shareholders recorded by September 9 will be eligible. Based on Tuesday’s closing price, the regular dividend equates to a 1.9% annual yield, not including any potential variable annual distribution.
The investor test is straightforward. Ongoing demand for hedging is expected to boost both EBS activity and listed FX contracts. A wider increase in rates and equity volumes would have a greater impact.
Risks: A quieter market may swiftly lead to a drop in trading volume. Declines in revenue per contract, increased technology expenses, and rivalry from perpetual futures could also weigh on results.
Related articles: NASDAQ:CME



CME Group
FX hedging is accelerating, but rates still drive the volume engine.