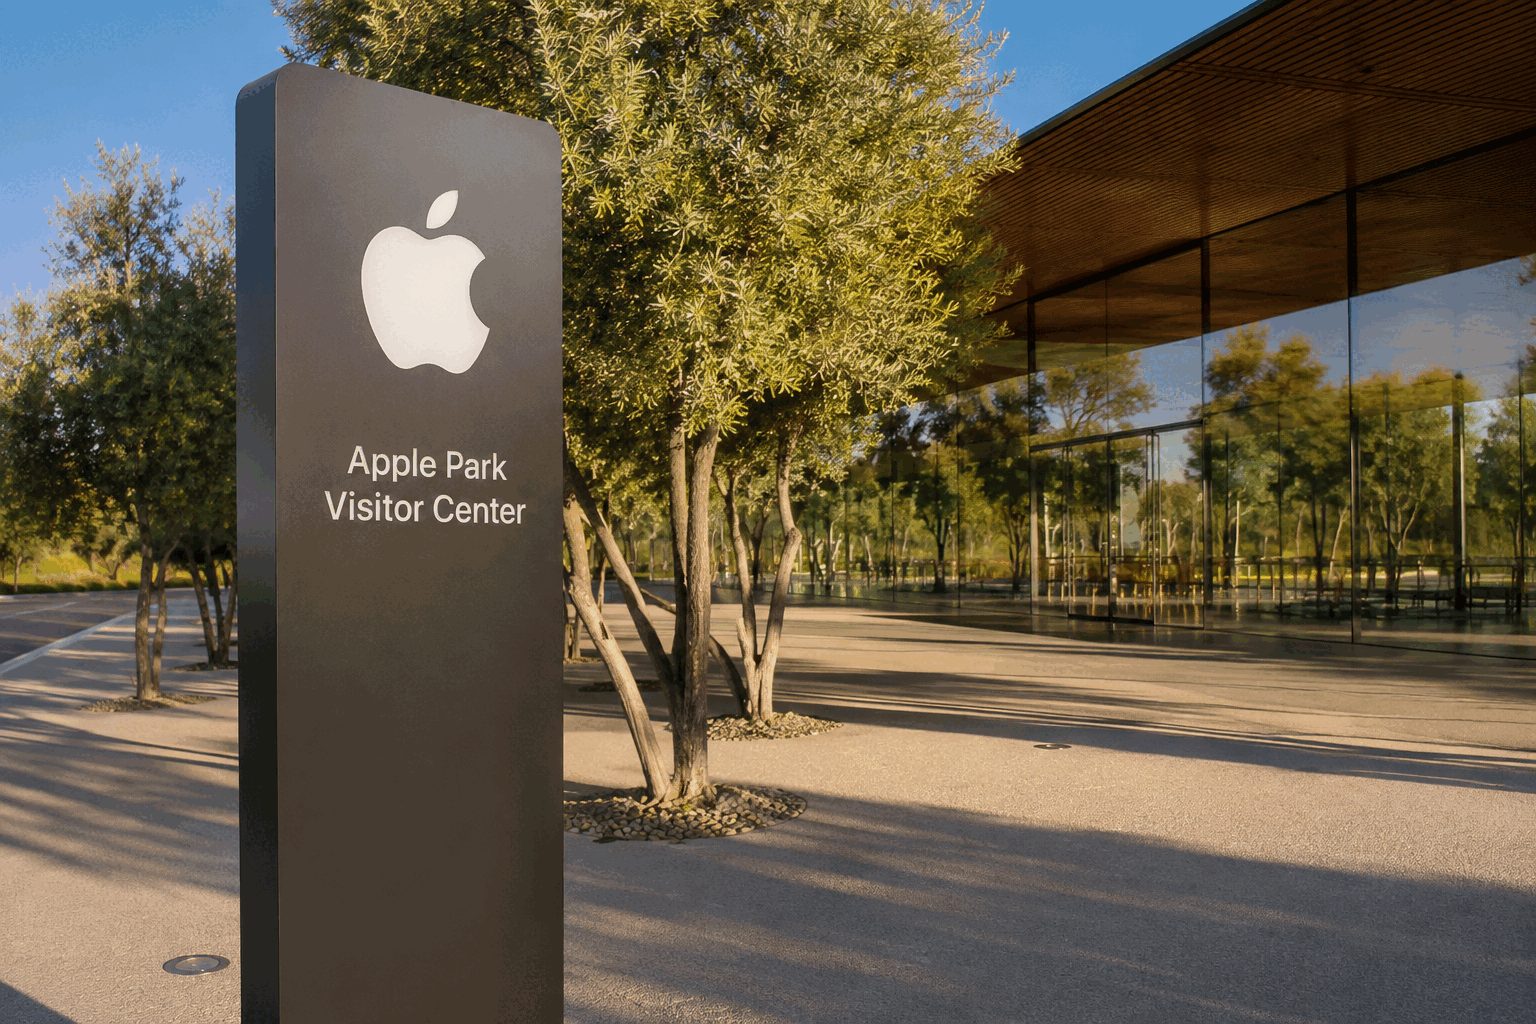

CUPERTINO, California, August 18, 2026, 16:50 PDT — U.S. markets were closed.
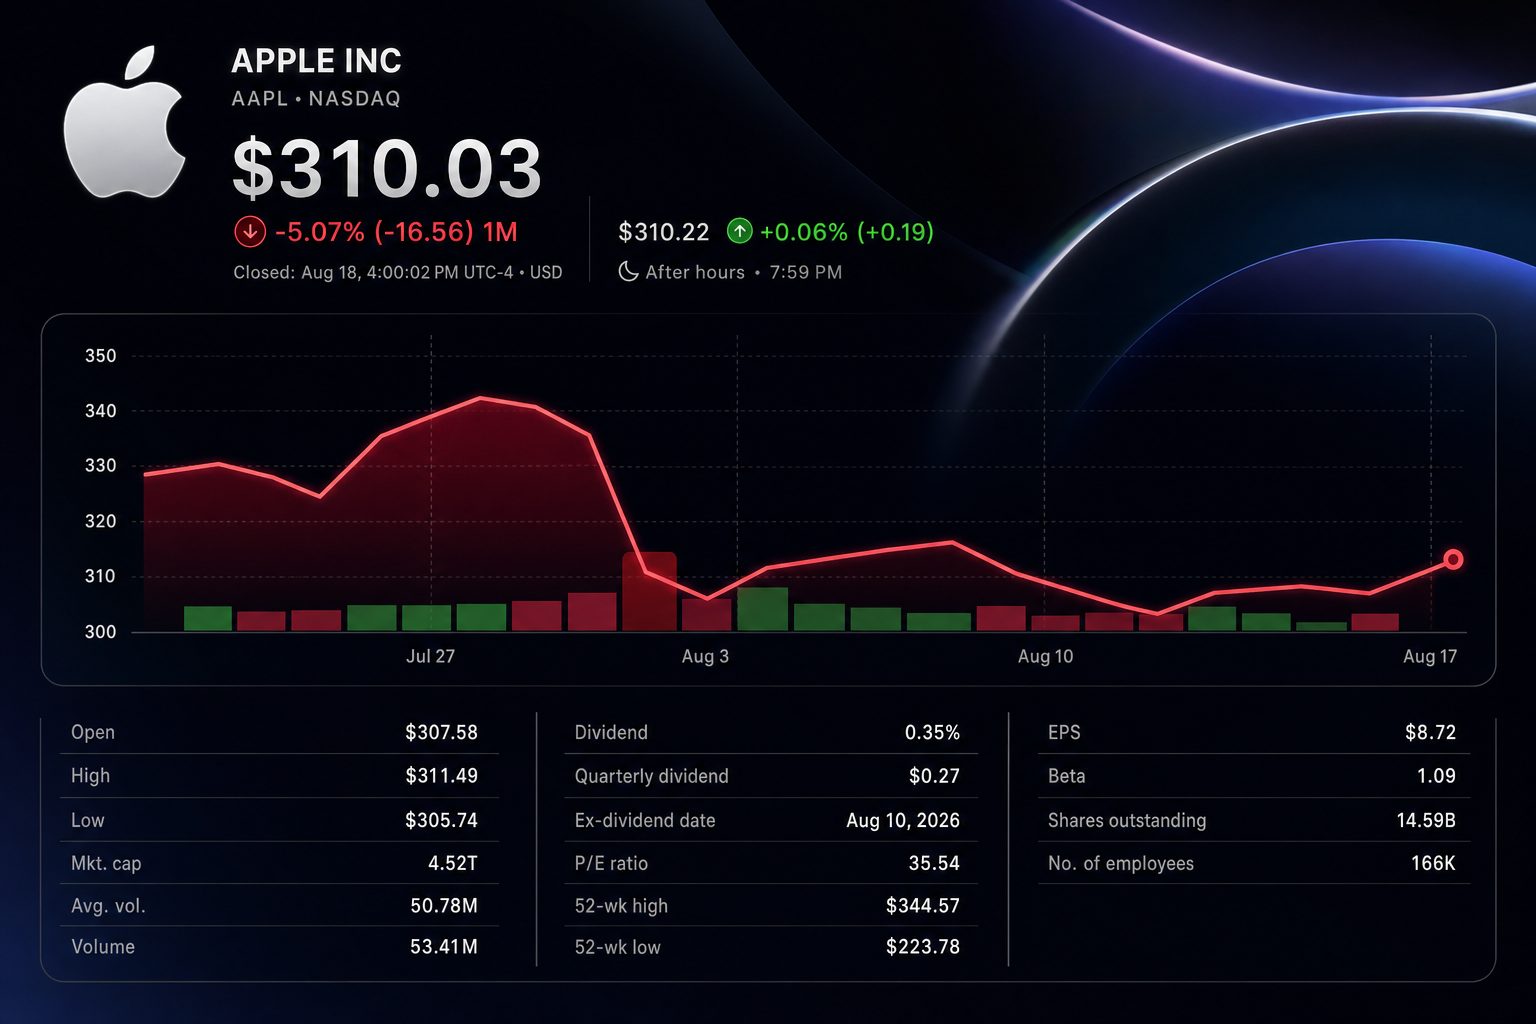
- Apple shares closed 1.5% higher at $310.03 on Tuesday.
- iPhone revenue rose 21.7% to a June-quarter record of $54.25 billion.
- A reported $200 Pro Max price rise would equal a 16.7% increase.
Apple Inc. NASDAQ:AAPL rose 1.5% to $310.03 on Tuesday. The gain came as searches accelerated for the unannounced iPhone 18 Pro Max. Apple has not confirmed the model, its price or an event date.
The investor test is unusually clean. Apple enters the expected September cycle with record iPhone revenue, but rising component costs threaten margins. A price increase could protect profit per device while testing demand.
Tuesday’s session put Apple near the top of its recent range. Volume reached 53.34 million shares.
| Apple market snapshot | August 18, 2026 | Change / context |
|---|---|---|
| Close | $310.03 | +1.5% |
| Open | $307.58 | $2.45 below close |
| Intraday high | $311.49 | 0.5% above close |
| Intraday low | $305.74 | 1.4% below close |
| Volume | 53.34 million | 39.6% above Monday |
Current reporting points to September launches for the Pro and Pro Max models. However, timing and specifications remain unofficial. MacRumors cited an IDC estimate of a $1,399 Pro Max starting price.
That would add $200 to the current iPhone 17 Pro Max entry price. The comparison implies 16.7% more revenue per unit before mix, discounts and carrier subsidies. It is a scenario, not company guidance.
Apple’s current U.S. pricing provides the verified baseline.
| Pro Max pricing comparison | Starting price | Increase |
|---|---|---|
| iPhone 17 Pro Max, official | $1,199 | Baseline |
| iPhone 18 Pro Max, IDC estimate | $1,399 | $200 / 16.7% |
| 1TB iPhone 18 Pro Max, Counterpoint estimate | Not specified | About $300 |
The starting point is strong. Fiscal third-quarter iPhone sales climbed 21.7% to $54.25 billion. They supplied 49.6% of Apple’s $109.42 billion revenue.
Growth also broadened beyond phones. Mac sales rose 28.7%, while services gained 12.1%. Only iPad revenue declined.
| Fiscal Q3 product line | 2026 revenue | 2025 revenue | Year-over-year |
|---|---|---|---|
| iPhone | $54.25B | $44.58B | +21.7% |
| Services | $30.74B | $27.42B | +12.1% |
| Mac | $10.35B | $8.05B | +28.7% |
| Wearables, Home and Accessories | $7.88B | $7.40B | +6.5% |
| iPad | $6.19B | $6.58B | -5.9% |
| Total | $109.42B | $94.04B | +16.4% |
Margins remain the pressure point. Apple reported a 50.1% company gross margin, including about two percentage points from tariff refunds. The underlying figure was roughly 48.1%.
Management forecast a 47% to 48% September-quarter margin. It also projected mid-teens iPhone growth, below Wall Street’s 17.6% target. Chief Executive Tim Cook told Reuters the supply chain had “less flexibility” amid strong demand. Reuters
Wall Street remains positive, but conviction has softened. Bullish ratings fell to 30 from 34 three months earlier. Bearish calls rose to five from three.
| Analyst recommendation | Current | One month ago | Three months ago |
|---|---|---|---|
| Buy | 22 | 25 | 25 |
| Overweight | 8 | 8 | 9 |
| Hold | 12 | 13 | 15 |
| Underweight | 2 | 3 | 1 |
| Sell | 3 | 2 | 2 |
| Consensus | Overweight | Overweight | Overweight |
The average target is $334.23, or 7.8% above Tuesday’s close. The $245-to-$400 range spans a 63% gap. That divide captures the central debate: pricing power versus demand and margin risk.
| Target-price view | Price | Return from $310.03 |
|---|---|---|
| High | $400.00 | +29.0% |
| Median | $340.00 | +9.7% |
| Average | $334.23 | +7.8% |
| Low | $245.00 | -21.0% |
Recent calls show that split. Citi kept a Buy rating and raised its target to $365, citing the launch as a catalyst. Jefferies cut Apple to Underperform with a $263.66 target, citing product differentiation and cost concerns.
Risks: Apple could hold prices, delay products or launch a different mix. Rumored specifications may be wrong. Higher prices could weaken unit demand, while memory constraints and regulation could pressure margins.
The next decisive data point is Apple’s event announcement. Investors need an official price more than another design leak. A $1,399 Pro Max would turn the margin debate into a live demand test.
Related articles: NASDAQ:AAPL


Apple’s $200 iPhone price test
Market data at 4:00 PM EDT, August 18, 2026 · U.S. market closed · U.S. dollars unless stated
Market snapshot
Pro Max pricing scenario
Apple has not confirmed the model, price or launch date. This is an investor scenario, not guidance.
Fiscal Q3 2026 revenue mix
Analyst recommendations
Consensus remains Overweight. Bullish calls fell from 34 three months ago, while bearish calls rose from three.