
AUSTIN, August 18, 2026, 18:50 CDT
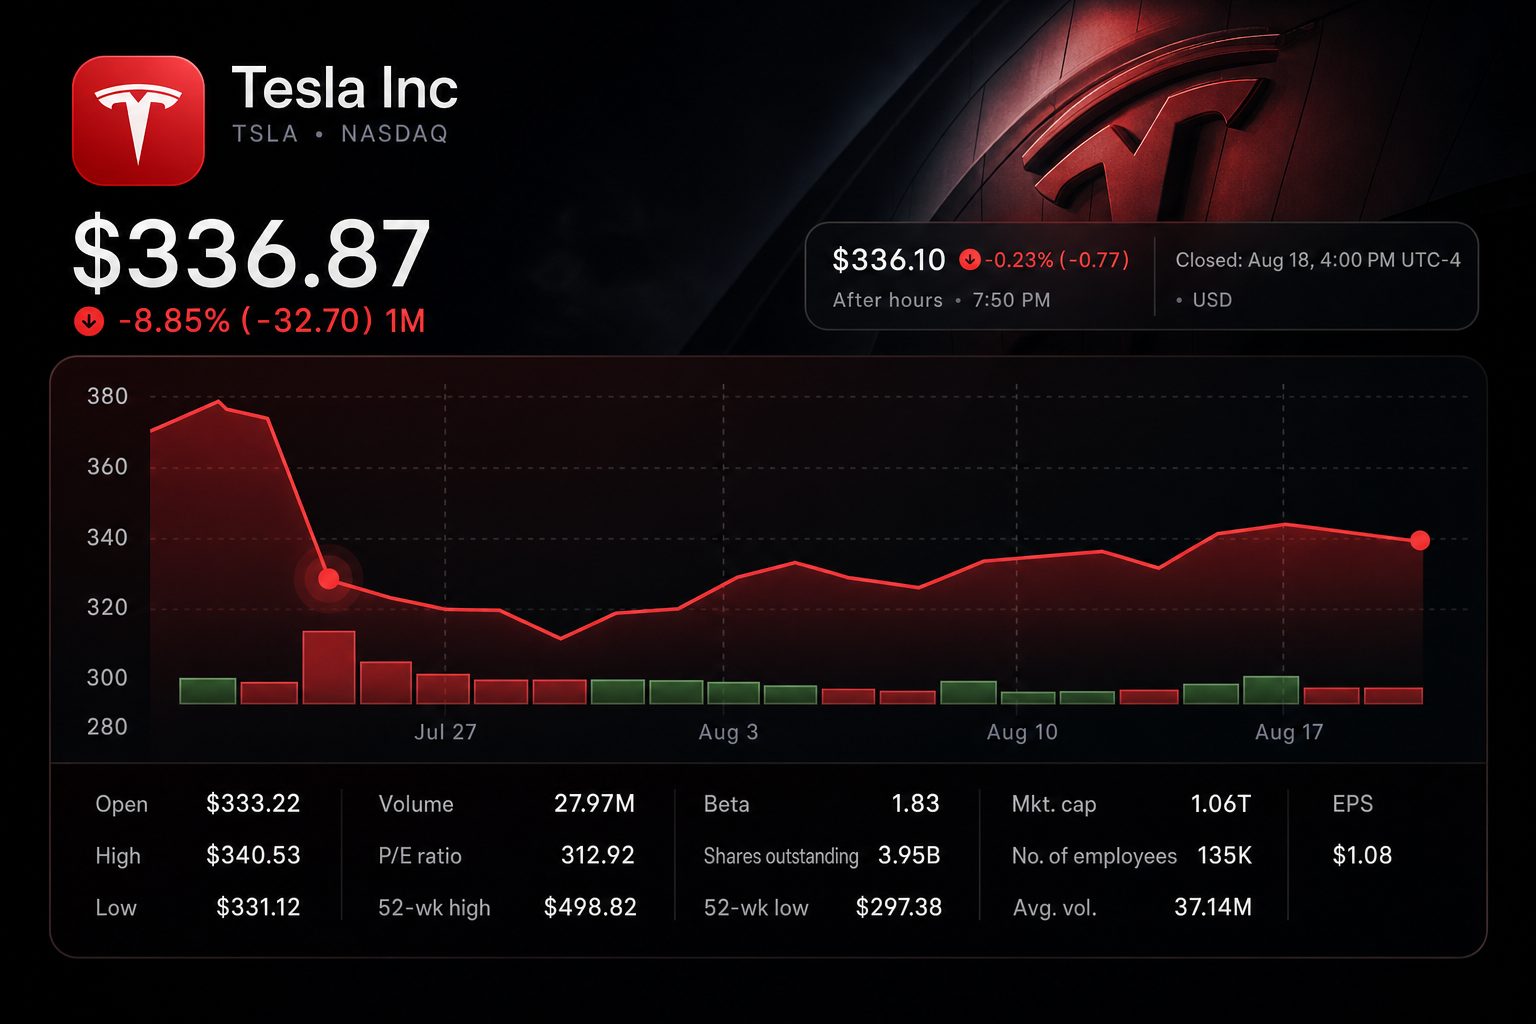
Tesla NASDAQ:TSLA shares ended Tuesday down 0.72% at $336.87. The stock’s decline continued despite reports of an August Cybercab rollout. Scaling remains the main challenge: Tesla has revealed around 380,000 paid unsupervised Robotaxi miles, in contrast to Alphabet’s NASDAQ:GOOGL Waymo, which logs about 4 million rider-only miles weekly. That represents a 10.5-times difference.
The comparison is more significant than when it is launched. Cybercab has the ability to expand its fleet, but revenue depends on utilization and the number of safe, unsupervised miles. Tesla’s total so far amounts to about two-thirds of the miles Waymo covers in a single day.
| Market measure | August 18 close | Investor read-through |
|---|---|---|
| TSLA price | $336.87 | Slipped 0.72% during the session |
| Day range | $331.12–$340.53 | Finished in the session’s top half |
| 52-week range | $297.38–$498.83 | Shares 32.5% under the 12-month peak |
| Nasdaq Composite | Down 1.33% | Yield-driven selling hit growth stocks |
Tesla informed employees it could launch Austin rides for staff as soon as this month, Reuters reported, referencing The Information. Public Robotaxi operations might begin just days afterwards. The company has been testing production Cybercabs on public streets since June.
The vehicle lacks a steering wheel and pedals, leaving it reliant on autonomy, teleoperations, and fleet support. This design means a restricted rollout to employees serves as a practical operating trial rather than confirming commercial scale.
| Robotaxi scale marker | Tesla | Waymo | Gap |
|---|---|---|---|
| Unsupervised or rider-only miles | Roughly 380,000 cumulative paid miles | Roughly 4 million per week | Waymo’s weekly run rate is 10.5 times Tesla’s cumulative figure |
| Commercial footprint | Unsupervised operations in six cities | Paid operations in 10 cities | Waymo holds a four-city advantage |
| Paid rides | Not reported | 500,000 weekly | No public number from Tesla |
| Purpose-built fleet | Cybercab debut awaited | Fleet exceeds 3,000 active vehicles | Tesla approaching fleet deployment |
Waymo maintains a clear advantage, having logged 500,000 paid rides each week and 4 million miles without a driver in March. By comparison, Tesla reported its Robotaxi service recorded almost 2.5 million paid miles by the second quarter, but just 380,000 of those were operated without supervision.
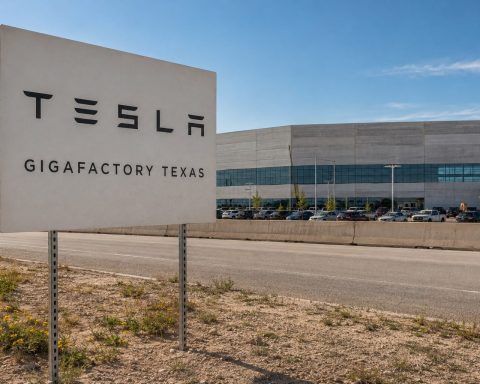
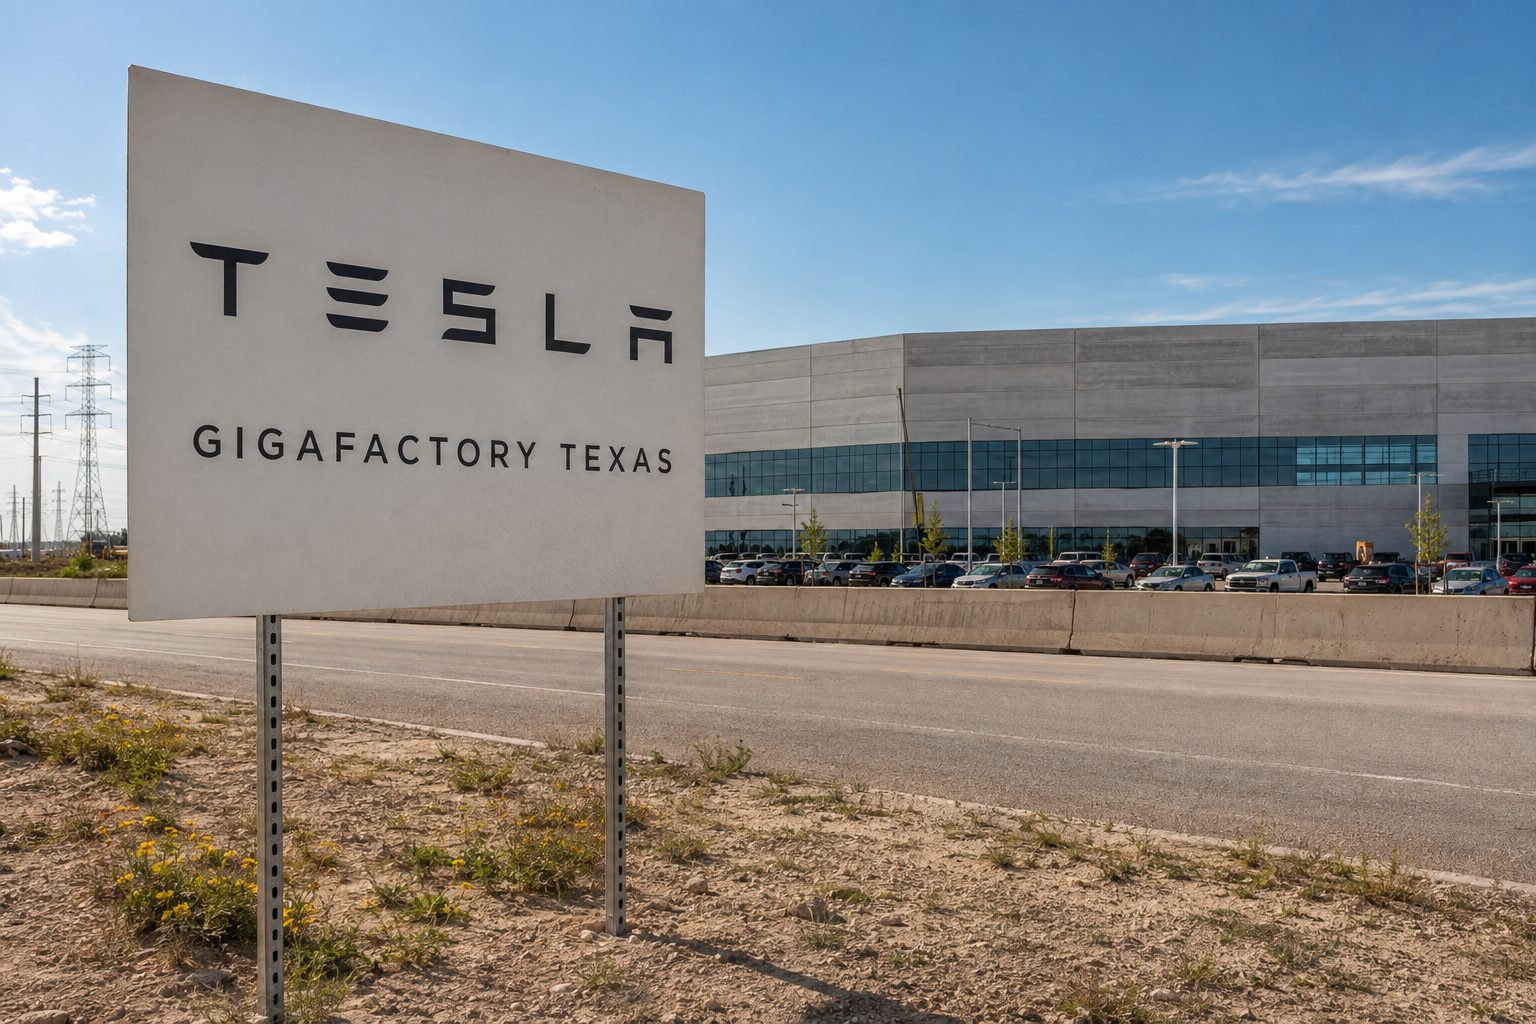
Tesla’s production capability is greater. The company stated Texas can build over 125,000 Cybercabs each year. However, unused capacity means little without necessary approvals, customer interest, and strong daily utilization. Investors will need to see these developments next.
Regulatory action is underway, though in a limited fashion. The National Highway Traffic Safety Administration (NHTSA) approved an exemption for Amazon’s NASDAQ:AMZN Zoox, allowing up to 2,500 custom vehicles each year over two years. Tesla maintains its Cybercab meets current federal regulations, setting it on a separate trajectory. Approval at the state and local level continues to be significant.
| Capital measure | Q2 or first-half 2026 | Year-over-year comparison |
|---|---|---|
| Q2 revenue | $28.24 billion | 26% increase |
| Q2 net income attributable to common holders | $1.11 billion | Decrease of about 5% |
| First-half operating cash flow | $8.63 billion | Rose from $4.70 billion |
| First-half capital spending | $8.28 billion | Higher than $3.89 billion |
| First-half cash after capital spending | About $0.35 billion | Dropped from about $0.81 billion |
The cash outlay increases the challenge. In the first half, Tesla allocated $8.28 billion to property and equipment. Operating cash flow surpassed that spending by just $352 million, a calculated value before accounting for additional investment uses. According to Tesla, the expenditures are for AI infrastructure, manufacturing facilities, and its product development plans.
Morgan Stanley analyst Andrew Percoco stated that a higher level of confidence hinges on “clearer evidence that Robotaxi is scaling.” He pointed to the need for more vehicles, increased urban density, a rise in unsupervised miles, and improved unit economics. According to Percoco, the Cybercab launch only meets the first requirement. Morgan Stanley note via Yahoo Finance
| Analyst or consensus | Recommendation | Target | Upside from $336.87 |
|---|---|---|---|
| MarketBeat, 45 analysts | Hold: 22 buy, 19 hold, 4 sell | $402.24 average | 19.4% |
| Morgan Stanley | Equal Weight | $400 | 18.7% |
| Piper Sandler | Overweight | $450 | 33.6% |
| TD Cowen | Buy | $460 | 36.6% |
| Truist | Hold | $370 | 9.8% |
| High / low published range | Varied | $600 / $25.28 | 78.1% / -92.5% |
Wall Street’s estimates still show an unusually broad spread. MarketBeat’s average forecast of $402.24 indicates a potential 19.4% gain from Tuesday’s closing price. The lowest projection points to a near-complete loss, while the highest sees a possible 78% rise. Divergence in autonomy expectations is a key driver behind the wide range.
Risks: Tesla has not confirmed the reported launch date, which remains subject to change. Deployment could be delayed by safety incidents, intervention rates or permitting issues. Higher mileage growth or improved utilization might also reduce the gap sooner than anticipated.
The upcoming investable indicator is not another gold car driving around Austin. It will be weekly reporting that reveals increases in unsupervised mileage, trips per car, and earnings per mile. Until those disclosures appear, Cybercab continues to be a capacity narrative under a utilization challenge.
Related articles: NASDAQ:TSLA



Tesla Robotaxi
scale test
Market closed
August 18, 2026 · 4:00 PM ET
Prices in U.S. dollars
Tesla’s cumulative disclosed unsupervised total equals about 0.67 day of Waymo’s weekly pace.
Cities with Tesla unsupervised miles versus Waymo paid rides.
Derived from Tesla’s six-month cash-flow statement; before other investing uses.
Revenue, up 26% year over year.
Net income attributable to common holders.
The $402.24 consensus implies 19.4% upside; published targets span $25.28 to $600.
Watch weekly unsupervised miles, rides per vehicle and revenue per mile—not only the number of Cybercabs produced.