
BOSTON, August 21, 2026, 4:00 p.m. EDT – DraftKings stock climbed 4.6% as the company launched a $150 promotional initiative, examining effects on customer economics.
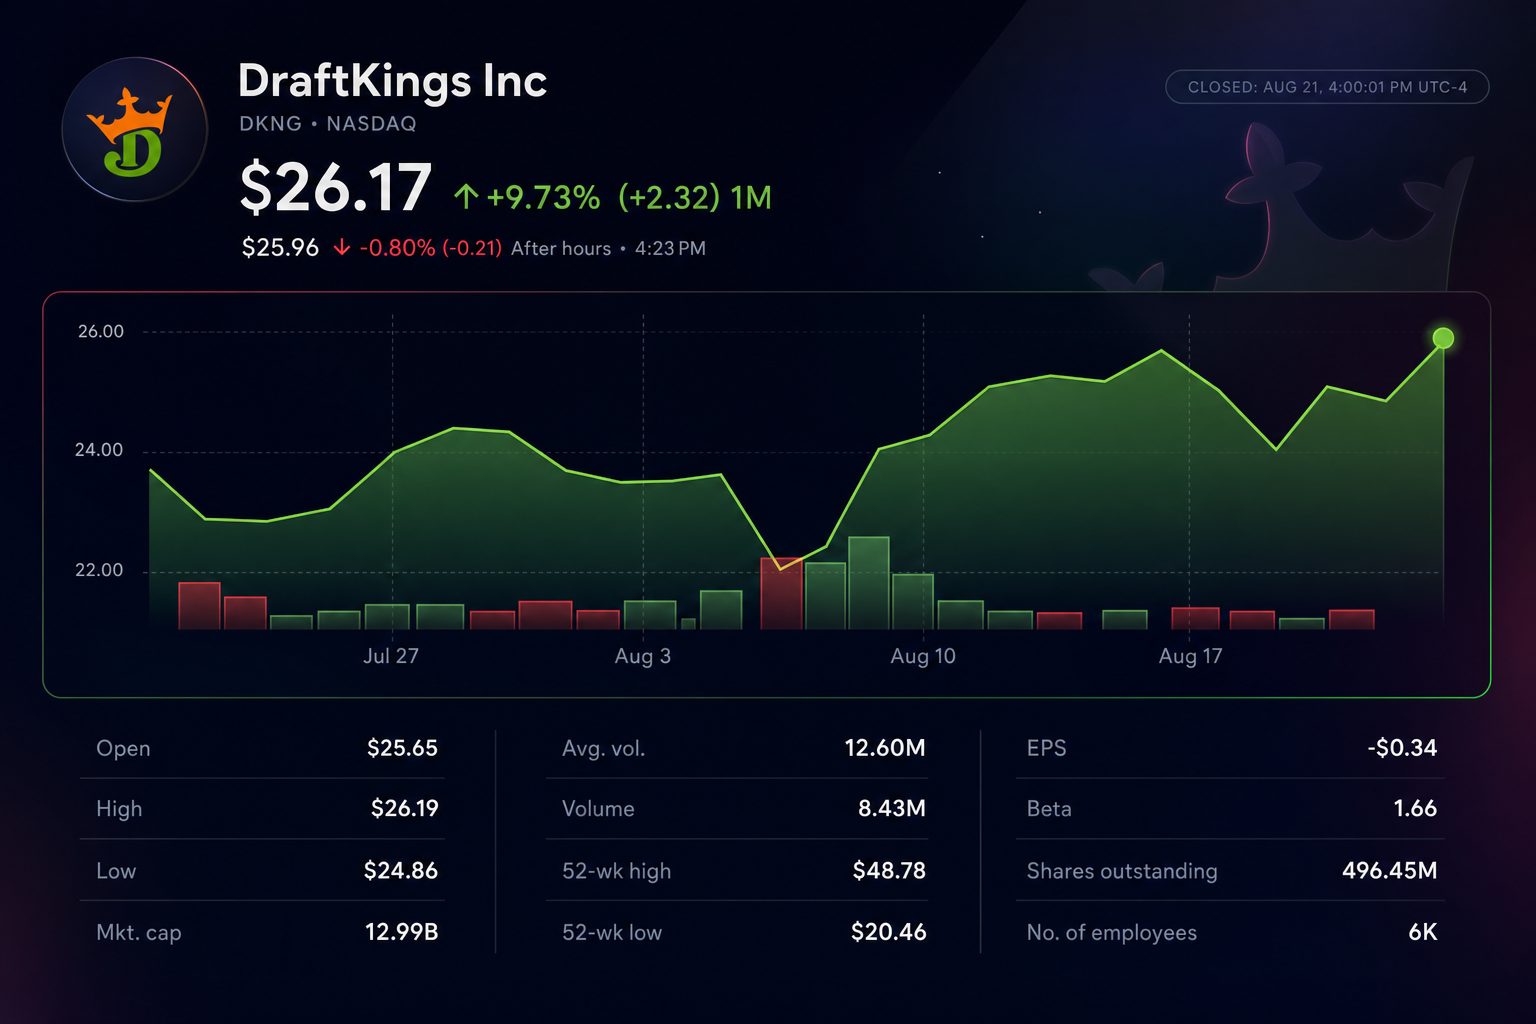
- DraftKings finished the session at $26.17, gaining 4.6%, with trading volumes coming in below average.
- The existing $150 signup incentive amounts to 1.14 times the quarterly revenue per paying user.
- The number of monthly payers in Q2 increased by 9%, but revenue per payer declined by 13%.
DraftKings Inc. NASDAQ:DKNG rose 4.6% on Friday after launching a $150 signup promotion that renewed attention on its customer-acquisition costs. The shares ended the day at $26.17, just off the session peak of $26.19. Trading volume reached 8.4 million shares, roughly 35% lower than the 20-day average.
The offer is significant in comparison to the company’s recent customer revenue. Its $150 headline amount is 1.14 times DraftKings’ $132 average second-quarter revenue per monthly unique payer. However, this does not represent a $150 cash expense. The bonus funds are not withdrawable and are distributed in six installments that each expire.
| Friday tape | Reading | Investor context |
|---|---|---|
| Close | $26.17 | Finished the day up 4.6% |
| Session range | $24.86–$26.19 | Ended two cents shy of session high |
| Volume | 8.40 million | Stood 34.6% under the 20-day average |
| One-week change | +0.1% | Little changed since August 14 |
| Distance from 52-week high | -46.3% | 52-week peak was $48.78 |
A $5 qualifying wager is needed for the offer. Six $25 bonus bets are delivered across 14 days. Each bonus segment must be used within seven days, and the deal ends August 23 at 11:59 p.m. ET. These conditions bring the economic value below its face value.
Friday’s push was promoted in conjunction with Major League Baseball matchups. An earlier campaign also included references to the NFL preseason. The scheduling is significant, because the football season often drives an uptick in new customers. It can also boost industry-wide advertising activity.
| Q2 operating measure | 2026 | Year-over-year change |
|---|---|---|
| Sports consumer volume | $13.1 billion | up 15% |
| Monthly unique payers | 3.6 million | increase of 9% |
| Revenue per monthly payer | $132 | down 13% |
| Revenue | $1.443 billion | decline of 5% |
| Adjusted EBITDA | $114.6 million | fell 61.9% |
Second-quarter figures highlight contrasting aspects of the business. Sports consumer volume climbed 15%, with monthly payers up 9%. However, total revenue declined 5% to $1.443 billion. DraftKings attributed the drop to favorable outcomes for customers and increased promotional spending in its Sportsbook and Predictions divisions.
Marketing expenses increased at a quicker pace than the growth in the customer base. Sales and marketing costs jumped 38.3% to $322.5 million, representing 22.4% of revenue, compared with 15.4% in the prior year. This remains the most prominent challenge for the latest campaign.
| Acquisition-economics test | Current reading | Comparison |
|---|---|---|
| Signup bonus nominal value | $150 | Equal to 30 times the $5 required wager |
| Bonus to Q2 revenue per payer | 1.14x | $150 compared to $132 |
| Q2 sales and marketing spend | $322.5 million | Increase of 38.3% compared to previous year |
| Marketing as revenue share | 22.4% | Risen by 6.9 percentage points |
| Q2 operating outcome | -$68.2 million | Against +$150.6 million |
Management has maintained its full-year forecast. DraftKings projects revenue between $6.5 billion and $6.9 billion. The company’s adjusted EBITDA guidance is still set at $700 million to $900 million. CFO Alan Ellingson said the core business is still targeting approximately $1 billion in adjusted EBITDA.
The balance sheet allows for additional spending, though boundaries remain. At the close of Q2, DraftKings reported $983.9 million in cash and carried roughly $1.92 billion in debt. Trailing free cash flow reached $650.9 million, representing a margin of 10.5%.
Analysts continue to express an optimistic outlook. Their average price target is $34.84, suggesting a potential gain of 33.1% from the close on Friday. The latest recommendation is less upbeat, with CBRE’s $27 target representing just a 3.2% premium to the current share price.
| Date | Firm | Rating | Target | Upside to $26.17 |
|---|---|---|---|---|
| August 21 | CBRE | Buy | $27 | 3.2% |
| August 18 | Benchmark | Buy | $30 | 14.6% |
| August 12 | Morgan Stanley | Buy | $36 | 37.6% |
| August 12 | Berenberg | Buy | $28 | 7.0% |
| August 12 | TD Cowen | Buy | $35 | 33.7% |
| Consensus | 36 analysts | Buy | $34.84 | 33.1% |
The gap illustrates the ongoing discussion. DraftKings is valued at roughly 2.1 times its trailing sales and 45.5 times forecast earnings. Early analyst projections put 2026 revenue at $6.68 billion, with earnings per share estimated at $0.89. The growth outlook is reflected in the price, but performance remains key.
Friday’s advance does not indicate that investors supported the promotion. Trading activity remained subdued, and the stock ended the week close to flat. Further insight will depend on subsequent data about payer growth, revenue per payer, and marketing costs as the football acquisition impact becomes clearer.
In the coming week, investors may monitor if DraftKings chooses to prolong the expiring offer and observe its marketing intensity during football season. Changes to full-year guidance will also be in focus. More generous promotions benefit only if subsequent wagering compensates for acquisition expenses.
Risks: Game outcomes that favor players may reduce revenue. Increased taxation, stricter responsible-gaming regulations, and competitive promotional offers from rivals may drive up costs. Forecast capital expenditure might require more time to generate returns.
Related articles: NASDAQ:DKNG