DKNG close
$24.22
−2.26%
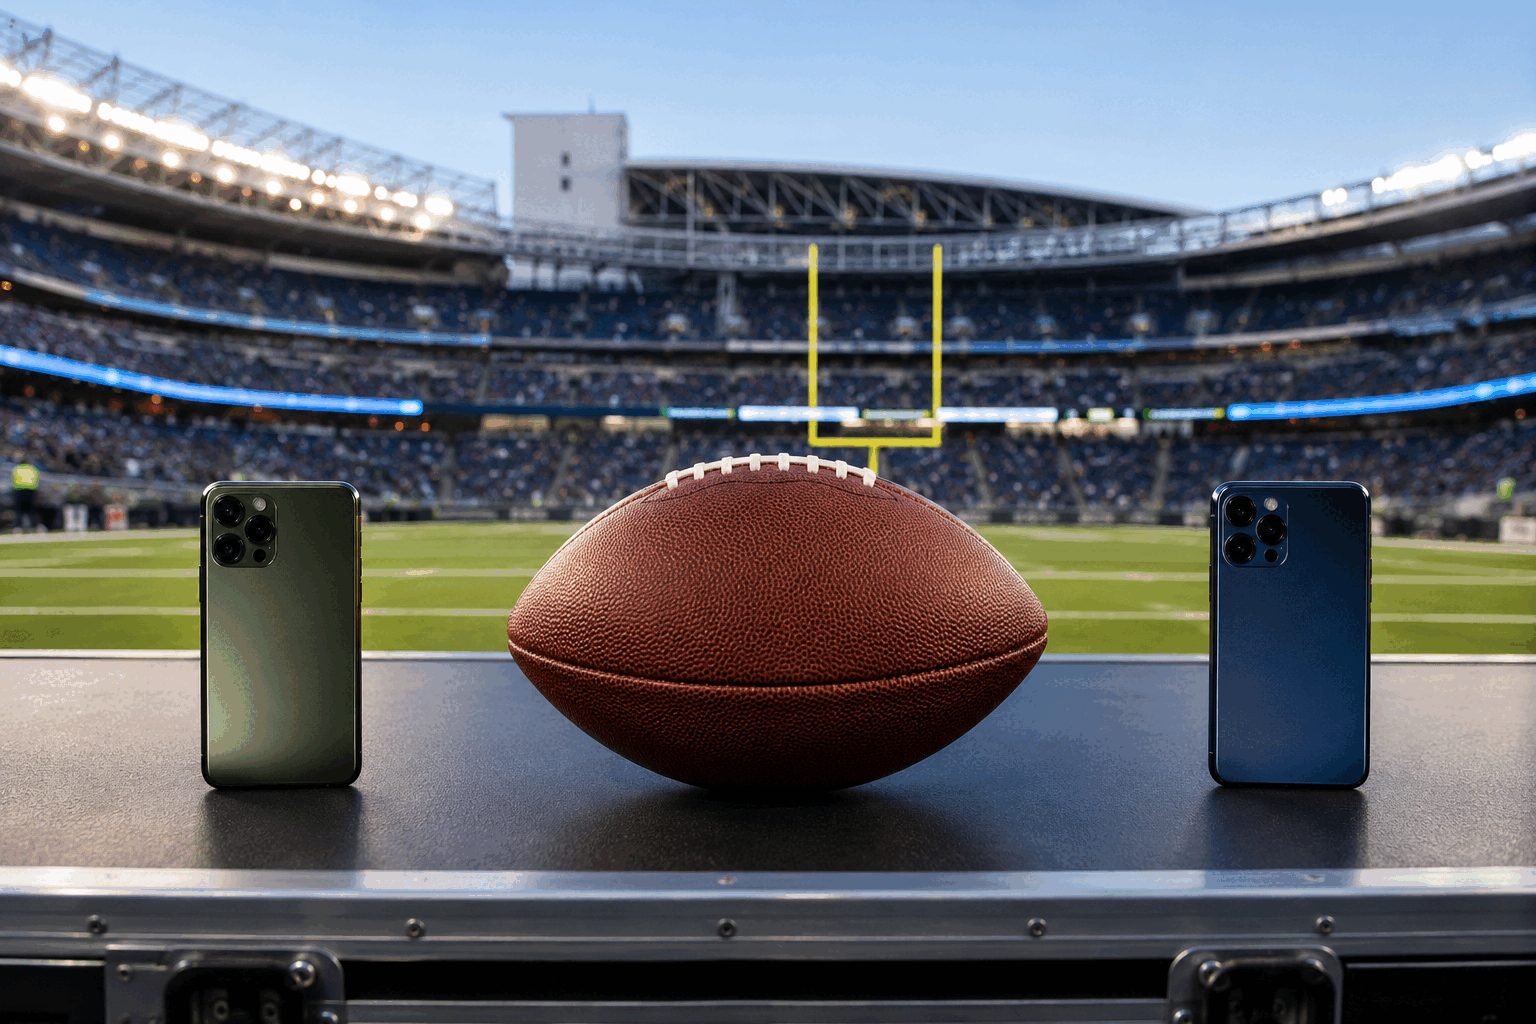
The NFL has extended its multi-year sportsbook agreements with DraftKings Inc. and Flutter Entertainment plc's FanDuel, and introduced Fanatics, a privately owned company, as its third operator. DraftKings' shares ended Thursday's session at $24.22, a decrease of 2.3%, with 7.42 million shares exchanging hands. In premarket trade at 04:01 EDT Friday, the stock was at $24.44, a gain of 0.9%.
NFL distribution is secured; unit economics remain the real contest.
Volume and users expanded, but game outcomes and promotions compressed monetization.
The renewal preserved distribution but did not reverse the de-rating.
| Signal | DraftKings | FanDuel parent Flutter | What matters |
|---|---|---|---|
| Q2 revenue | $1.443B, −5% | $4.326B, +3% groupwide | Growth quality diverged |
| Activity | $13.1B sports volume, +15% | FanDuel retains NFL sportsbook status | Access is broad; conversion decides value |
| Profit signal | FY26 EBITDA guide $700M–$900M | Q2 adjusted EBITDA $508M, −45% | Promotions and taxes pressure margins |
| Market close | $24.22, −2.3% | $95.01, −3.1% | Investors remain cautious |
DraftKings and FanDuel retain promotion, real-time statistics, event presence and NFL digital integrations. DraftKings also keeps daily fantasy status. Fanatics joins as a third sportsbook partner and gains online-casino marketing rights.
Positive: payer retention and cross-sell. Negative: customer-friendly results or higher acquisition costs.

The $5-to-$200 welcome offer raises the stakes for customer acquisition as revenue per payer softens.
The campaign ends September 20, 2026 at 23:59 EDT. Each bonus bet expires seven days after issuance. The economic cost can differ from face value because bonus stakes are not returned with winnings.
DraftKings added payers, but generated less monthly revenue per payer. At the same time, sales and marketing spending rose sharply. The offer therefore tests whether new volume can offset weaker yield without compressing margins.
| Metric | Q2 2026 | Year over year |
|---|---|---|
| Revenue | $1.443bn | −5% |
| Monthly unique payers | 3.6m | +9% |
| ARPMUP | $132 | −13% |
| Sportsbook handle | $13.1bn | +15% |
| Sales & marketing | $322.5m | +38% expense |
| Net income (loss) | ($67.6m) | vs +$157.9m |
| Revenue guide | $6.5–$6.9bn |
| Adjusted EBITDA | $700–$900m |
| Mobile sportsbook footprint | 27 states + DC + PR |
| YTD stock move | −28.09% |
| One-year stock move | −48.62% |
More funded accounts lift handle, and retention spreads acquisition cost across future betting activity.
User growth remains positive, but promotion intensity keeps revenue per payer and near-term margins under pressure.
Rivals match offers, customer-friendly outcomes persist, or higher taxes and regulation dilute promotional returns.
Wednesday’s stock decline is not attributed solely to the promotion. The dashboard separates verified market activity from the acquisition-economics question raised by the current offer. Sources: DraftKings promotions, bonus-bet rules, DraftKings Q2 release, SEC Form 10-Q, MarketWatch close report, and StockAnalysis analyst snapshot.
| Metric | Q2 2026 | YoY |
|---|---|---|
| Revenue | $1.443B | −4.6% |
| Marketing | $322.5M | +38.3% |
| Sports margin | 6.8% | −190 bps |
| Adj. EBITDA | $114.6M | −61.9% |
| Company | Forward P/E | Price / sales | 52-week move |
|---|---|---|---|
| DraftKings | 47.60× | 2.09× | −42.67% |
| MGM Resorts | 24.69× | 0.62× | +20.46% |
| Flutter | 16.88× | 1.04× | −65.16% |
| PENN | 11.73× | 0.33× | −0.13% |
Market data: Aug. 21, 2026, 4:00 p.m. EDT / 22:00 CEST · U.S. market closed
| Measure | Current / Q2 2026 | Comparison |
|---|---|---|
| Qualifying sportsbook wager | $5 | $150 bonus credits |
| Monthly unique payers | 3.6m | +9% YoY |
| Revenue per payer | $132 | −13% YoY |
| Sales & marketing | $322.5m | +38.3% YoY |
| Adjusted EBITDA | $114.6m | −61.9% YoY |
Friday's 4.55% rebound erased the week's earlier losses. On the same day, DraftKings completed a $700m term loan for a partial repurchase of 2028 convertibles.
The week still ended almost flat. Causation between the financing and the share move is not established.
The advertised $150 reward is not a $150 cash expense. Credits can expire, are non-withdrawable and exclude the stake from winnings. The sharper test is whether the promotion produces retained NFL customers. Watch payer growth, revenue per payer and sports margin together; registrations alone cannot settle the argument.
A bettor-friendly NFL start could combine with sustained promotions to hold sports margin below last year's 8.7%. The positive case gains evidence if payer growth stays strong while revenue per payer recovers from $132.
DraftKings Inc. · NASDAQ:DKNG · Weekend investor view
Headline incentive equals 30× the qualifying wager. Bonus bets are nonwithdrawable and jurisdiction-specific.
Token expiry and wagering restrictions reduce the economic value below the headline amount.
The 25.1-point gap between sports-volume growth and sports-revenue growth is the key conversion test.
| Measure | Q2 2026 | Q2 2025 | YoY |
|---|---|---|---|
| Monthly unique payers | 3.6m | ~3.3m | +9% |
| Revenue per payer | $132 | $151 | −13% |
| Sports volume | $13.14bn | $11.47bn | +14.5% |
| Sports net margin | 6.8% | 8.7% | −1.9pp |
| Adjusted EBITDA | $114.6m | $300.6m | −61.9% |
| Net income | −$67.6m | $157.9m | Swing to loss |
| Company | Friday | Week | YTD | EV/EBITDA |
|---|---|---|---|---|
| DraftKings | +4.55% | +1.87% | −24.34% | 120.0× |
| Flutter | +3.05% | +2.92% | −52.57% | 12.7× |
| MGM Resorts | +1.32% | −0.75% | +19.41% | 17.6× |
| PENN Entertainment | +1.11% | −0.98% | +25.64% | 14.1× |
DraftKings led Friday, but its EBITDA multiple prices in a much larger earnings recovery.
Eight-target average: $32.50, about 24% above Friday's close.
Management says the core business can generate about $1bn of adjusted EBITDA before investment in Predictions.
Sources: DraftKings Q2 2026 results and events page; MarketWatch; TradingView; current offer summaries from Covers and SportsLine; analyst actions compiled from Benzinga and The Fly. Stock data are at the Nasdaq close on August 21, 2026, 4:00 p.m. EDT. Promotions vary by jurisdiction and eligibility. Analyst targets are opinions, not guarantees.
The $150 headline is acquisition bait, not a measured cash expense. Watch whether football-season payer growth arrives without another sharp drop in revenue per payer or another step-up in marketing as a share of sales.
−1.44% · down $0.36
Trading volume stood at 4.68 million shares, compared with an average daily volume of 12.78 million shares at the time of the snapshot.
A $5 qualifying bet triggers the $150 bonus. Face value does not equal cash outlay; terms, redemption and eligibility apply.
| Metric | 2026 | 2025 | Change |
|---|---|---|---|
| Sports consumer volume | $13.14bn | $11.47bn | +14.5% |
| Monthly unique payers | 3.6m | ~3.3m | +9% |
| Revenue per payer | $132 | $151 | −12.6% |
| Revenue | $1.443bn | $1.513bn | −4.6% |
| Sales & marketing | $322.5m | $233.2m | +38.3% |
| Adjusted EBITDA | $114.6m | $300.6m | −61.9% |
Maintained range midpoints are: revenue between $6.5 billion and $6.9 billion, adjusted EBITDA from $700 million to $900 million. Management projects approximately $1 billion from the core business prior to the Predictions investment.
Out of 25 analysts, 22 have Buy ratings and three have Hold recommendations. The average price target of $33.21 suggested a 33.1% potential rise at the time of reporting.