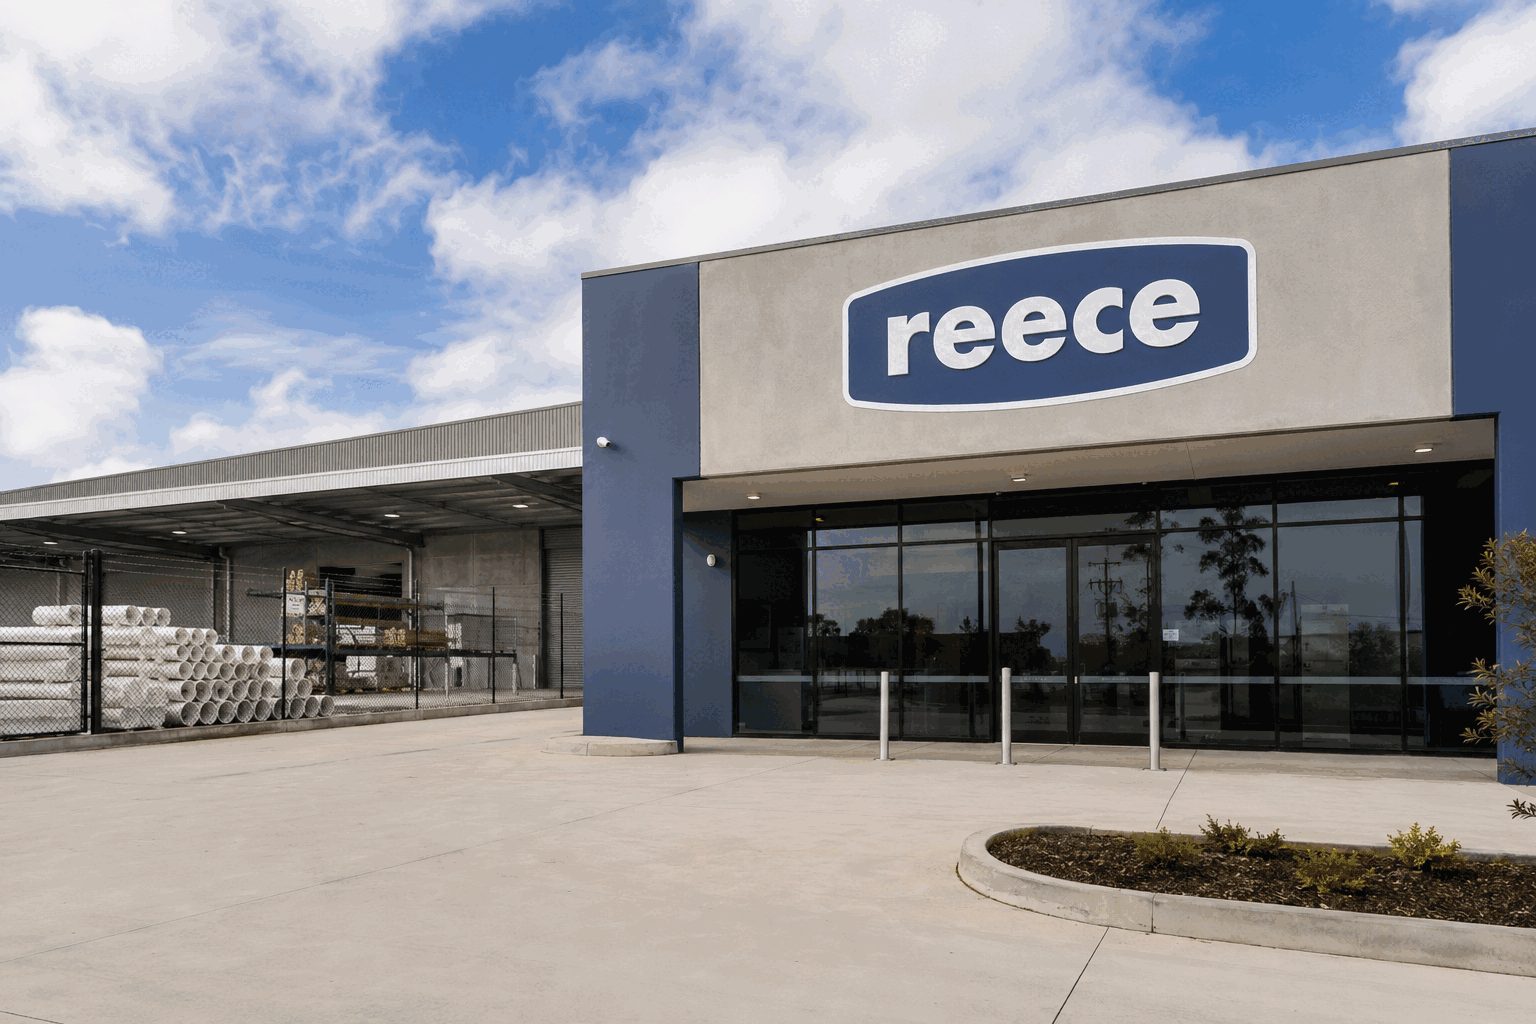

MELBOURNE, August 24, 2026, 12:15 AEST – Shares in Reece fell as the company posted a A$400 million annual sales gain that did not translate into higher EBITDA.
- Reece shares were last seen trading around A$15.79, down roughly 3% in Monday trading in Sydney.
- Sales for FY26 increased 4.5% to A$9.38 billion, with EBITDA steady at A$901 million.
- ANZ sales rose by 8.3%, while weaker U.S. housing demand limited profit growth.
- Prior to the results, analysts had an average target price of A$15.22, lower than the share price during intraday trading.
Reece Limited ASX:REH shares fell about 3% on Monday, following news that an additional A$400 million in yearly revenue failed to boost EBITDA. The plumbing supplier was trading close to A$15.79 by midday AEST, based on market data after the results were released.
This remains the main issue confronting investors. Revenue bounced back, notably in Australia and New Zealand. However, increased expenditures related to expansion and weak U.S. residential construction limited gains.
For the twelve months to June, annual sales rose 4.5% to A$9.378 billion. EBITDA held steady at A$901 million. EBIT declined by 2.6% to A$534 million, while net profit was down 2.8% to A$308 million.
| Group metric | FY26 | FY25 | Change |
|---|---|---|---|
| Sales revenue | A$9.378bn | A$8.978bn | +4.5% |
| EBITDA | A$901m | A$901m | Flat |
| EBIT | A$534m | A$548m | -2.6% |
| NPAT | A$308m | A$317m | -2.8% |
The data highlights the market’s uncertainty. The EBITDA margin fell to 9.6% from roughly 10.0%. The EBIT margin declined to 5.7%, compared with 6.1% previously. Additional sales generated reduced operating profit per dollar.
| Investor gauge | FY26 | FY25 | Read-through |
|---|---|---|---|
| EBITDA margin | 9.6% | 10.0% | Lower conversion |
| EBIT margin | 5.7% | 6.1% | Expansion depreciation weighs |
| Net leverage | 1.0x | 0.8x | Still moderate |
| Capital expenditure | A$174m | A$258m | Spending eased |
| Return on capital | 11.9% | 11.8% | Up 5 basis points |
Higher volumes resulted in regional sales in Australia and New Zealand rising by 8.3% to A$4.2 billion, contributing to improved performance. The U.S. market continued to be weak, even with 25 new branches opening over the year.
Chairman and CEO Peter Wilson stated that FY26 delivered “improved momentum” in ANZ, while expansion in the U.S. was constrained by subdued activity in the residential housing sector. Reece continued to prioritise investment in digital solutions and customer service. Reece investor releases
The final dividend increased to 13.40 Australian cents, fully franked. Including the interim dividend of 5.44 cents, the annual distribution amounted to 18.84 cents, marginally higher than the previous year’s total of 18.36 cents.
| Analyst recommendation | Count | Share |
|---|---|---|
| Strong buy | 2 | 14% |
| Buy | 3 | 21% |
| Hold | 6 | 43% |
| Sell | 0 | 0% |
| Strong sell | 3 | 21% |
| Consensus | 14 analysts | Hold |
S&P Global poll shown by Stock Analysis; targets last updated June 12, before the FY26 release. Average target A$15.22; range A$10.30–A$18.00.
Valuations leave limited margin for a modest rebound. The average target price is A$15.22, representing a discount of almost 4% compared to the midday share price. Among eight analysts, five have Buy or Strong Buy ratings, while three continue to rate the stock as Strong Sell.
Cash management saw gains in the second half. Net debt ended the period at A$744 million, a decrease from A$1.0 billion in December. Leverage increased from a year earlier as Reece supported branch expansion and continued its share repurchase program.
The upcoming focal point will be whether U.S. branches can grow further without creating extra strain on margins. ANZ’s volume increase adds weight to this perspective. Investors are still monitoring the affordability of U.S. mortgages and the pace of new homebuilding.
Risks: A more pronounced slowdown in the U.S. housing market may lengthen branch payback periods and squeeze margins. Conversely, a quicker recovery in ANZ, declining rates, or increased renovation work could boost earnings beyond current tempered expectations.



![US Stock Market Today 08/24/2026 [UPDATE: 00:06 EDT] [Alibaba Dilution Joins Memory Selloff in Overnight Trade]](https://ts2.tech/wp-content/uploads/2026/08/US-market-dashboard-2026-08-24-0003-480x384.jpg "US Stock Market Today 08/24/2026 [UPDATE: 00:06 EDT] [Alibaba Dilution Joins Memory Selloff in Overnight Trade]")