
SYDNEY, August 24, 2026, 13:15 AEST — City Chic’s shares surged 23% following recent market moves, yet the company still trades close to 1.2 times EBITDA.
- Shares of City Chic climbed up to 23.3% to A$0.053 following its FY26 results.
- Underlying EBITDA rose 92% to A$12.3 million, reflecting better gross margins and lower costs.
- The retailer is trading at about 1.2 times FY26 EBITDA after net cash, with shares priced at A$0.053.
- U.S. sales declined by 42.1%, maintaining significant execution risk even with improved trading in Australia.
Shares of City Chic Collective Limited ASX:CCX rose as much as 23.3% on Monday after the plus-size apparel retailer almost doubled its underlying earnings. The shares climbed to A$0.053 during Sydney trading, as reflected in market reaction following its results briefing.
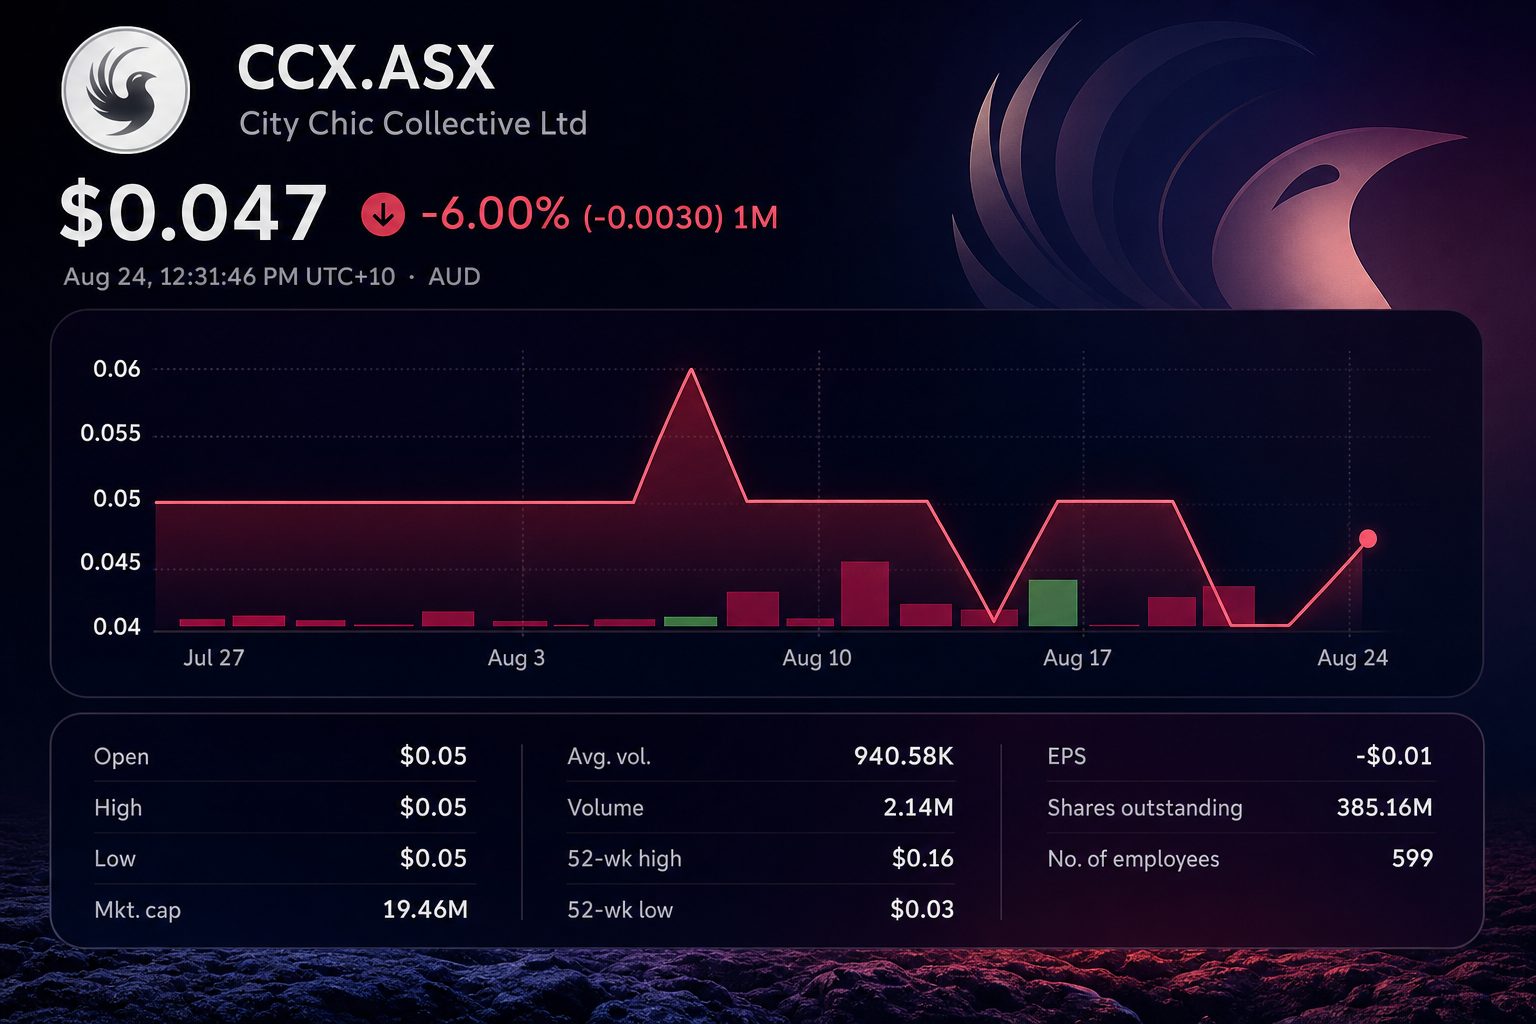
The surge maintains a significant valuation disparity. With shares at A$0.053 and 385.16 million in circulation, City Chic’s market capitalisation stands at around A$20.4 million. After deducting A$5.2 million in net cash, enterprise value comes to approximately A$15.2 million, which equates to close to 1.2 times forecast FY26 underlying EBITDA.
The low multiple indicates an incomplete turnaround. Global revenue declined 3.1% to A$130.5 million, and statutory net loss improved by just 25.5% to A$6.6 million. The path toward profitability is becoming more evident, though earnings quality is still unresolved.
| FY26 result | FY26 | FY25 | Change |
|---|---|---|---|
| Global sales | A$130.5m | A$134.7m | -3.1% |
| Underlying EBITDA | A$12.3m | A$6.4m | +92% |
| EBITDA margin | 9.4% | 4.7% | up 4.7 points |
| Statutory net loss | A$6.6m | A$8.9m | loss reduced by 25.5% |
| Inventory | A$24.1m | A$27.1m | -11% |
Margin improvements drove the gains. Trading gross margin increased by 209 basis points to reach 60.6%. Operating costs decreased by A$7.1 million, or 9.7%, falling to 51.7% of sales.
Australia and New Zealand drove growth, with regional sales climbing 7.6%, supported by a 9.5% rise in store numbers. Online sales fell 2.7%, and partner sales dropped 46.5%.
| Sales indicator | FY26 change | Investor read-through |
|---|---|---|
| Australia and New Zealand | +7.6% | Main market bounced back |
| United States | -42.1% | Inventory adjustment and withdrawal from wholesale |
| Store channel | +9.5% | Growth driven by brick-and-mortar stores |
| Online channel | -2.7% | Digital sales stayed weak |
| Partner channel | -46.5% | Wholesale presence shrank |
The U.S. pullback was intentional yet sharp. City Chic’s sales fell 42.1% as the company offloaded stock and exited wholesale channels. Investors now require proof that the streamlined American business will no longer drain management resources or capital.
Chief Executive Phil Ryan stated, “Cut for Curves is our fit promise to our customer. It’s at the core of our brand and remains our key strategic differentiator.” Company earnings release
Cash metrics provide modest backing. Operating cash flow totalled A$2.2 million. Inventory dropped by 11% to A$24.1 million, while the company closed June holding A$5.2 million in net cash and maintained access to a fully undrawn A$10 million facility through March 2028.
| Valuation bridge at A$0.053 | Amount |
|---|---|
| Total shares in issue | 385.16m |
| Indicative market cap | A$20.4m |
| Subtract net cash | A$5.2m |
| Indicative enterprise value | A$15.2m |
| EV to FY26 underlying EBITDA | 1.24x |
FY27 has begun with mixed results. ANZ like-for-like store sales increased by 11.4% in the first seven weeks, while store footfall climbed 14%. Online sales dropped 8%, resulting in overall same-store trading revenue remaining largely unchanged.
Chief Financial Officer James Plummer said, “The business remains some distance from where we ultimately want it to be, but profitability has continued to improve.” He noted that the underlying economics were trending positively. FY26 presentation coverage
Broker coverage remains very limited. Investing.com shows a consensus based on a single analyst, who assigns the stock a buy rating and sets a target price of A$0.25. This suggests potential upside of approximately 372% from A$0.053, but a single analyst’s view does not represent a comprehensive market consensus.
| Analyst recommendation | Count | Share of coverage |
|---|---|---|
| Buy | 1 | 100% |
| Hold | 0 | 0% |
| Sell | 0 | 0% |
| Consensus target | A$0.25 | Based on one analyst |
Risks are still significant. Sales in the U.S. continue to decline, online demand remains soft, and micro-cap liquidity may heighten price fluctuations. Underlying EBITDA does not include certain items that distinguish it from the statutory loss.
Conversion is the next key test. City Chic needs to translate increased ANZ traffic and improved inventory into reported profit and ongoing cash flow. Success on this front could see the current enterprise multiple re-rated. Failure to deliver, however, could mean Monday’s rise is short-lived.
Related articles: Stock Market