
SANTA CLARA, California, August 23, 2026, 06:22 PDT
- Options suggest an expected earnings move of approximately 6%, equivalent to around $312 billion in market capitalization.
- Analysts on Wall Street forecast second-quarter revenue at $92.16 billion, representing just a 1.3% increase over the company’s guidance.
- NVDA declined 4.64% last week, wiping out an initial $253 billion.
- Expected price hikes for AI servers in 2027 draw attention to input expenses and gross margins.
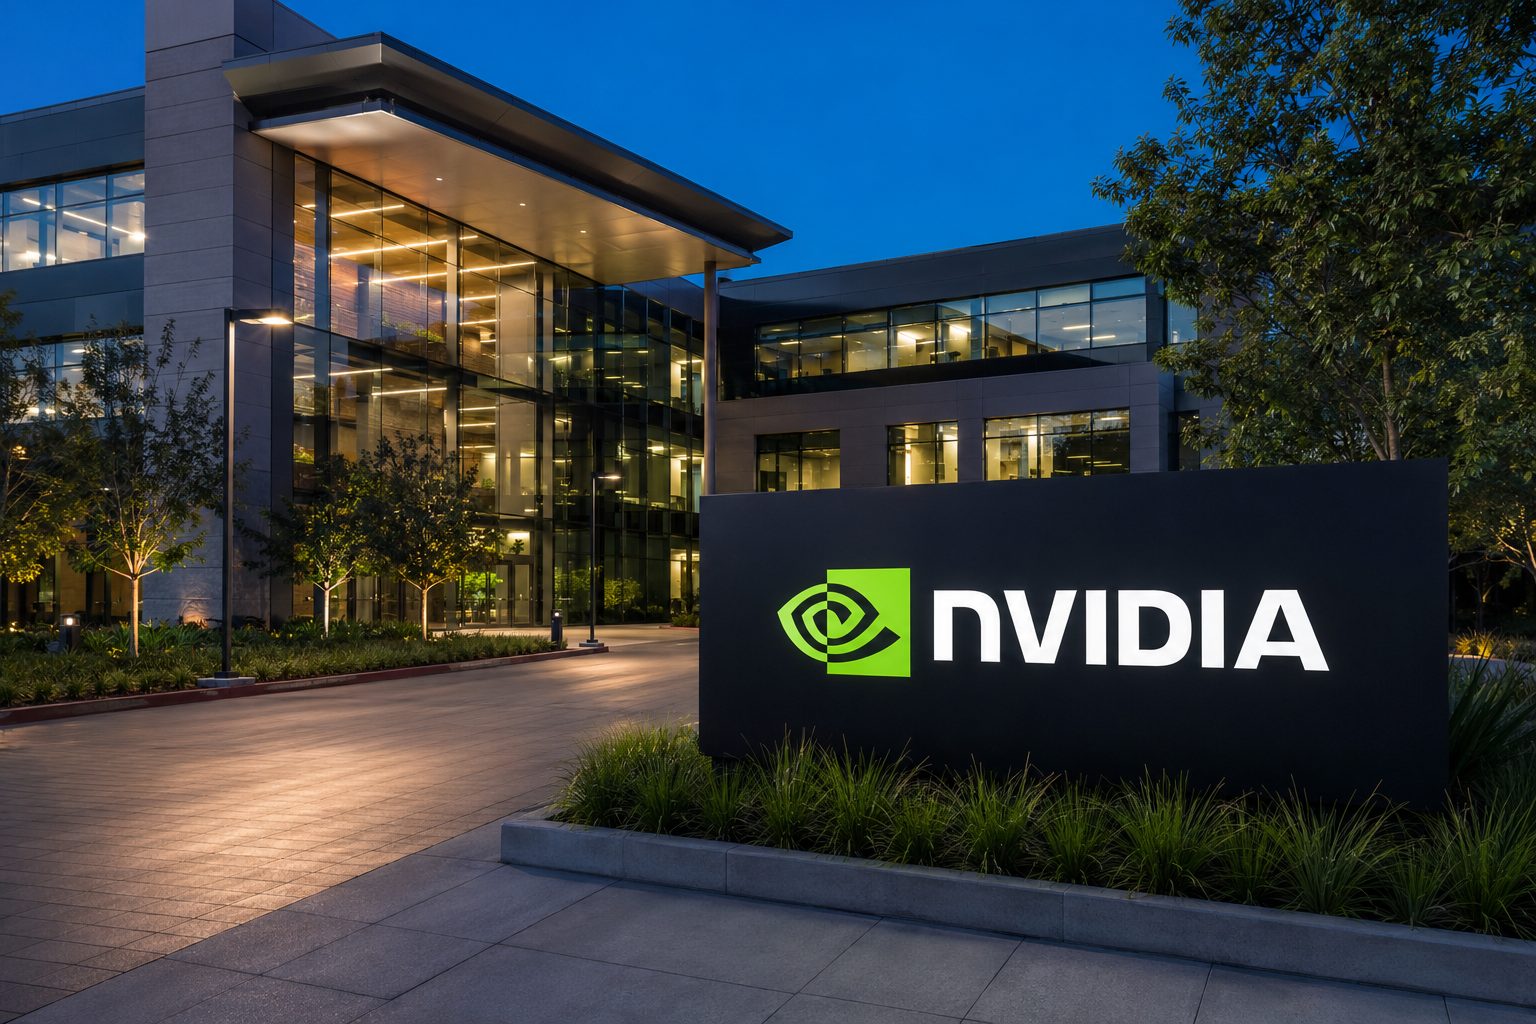
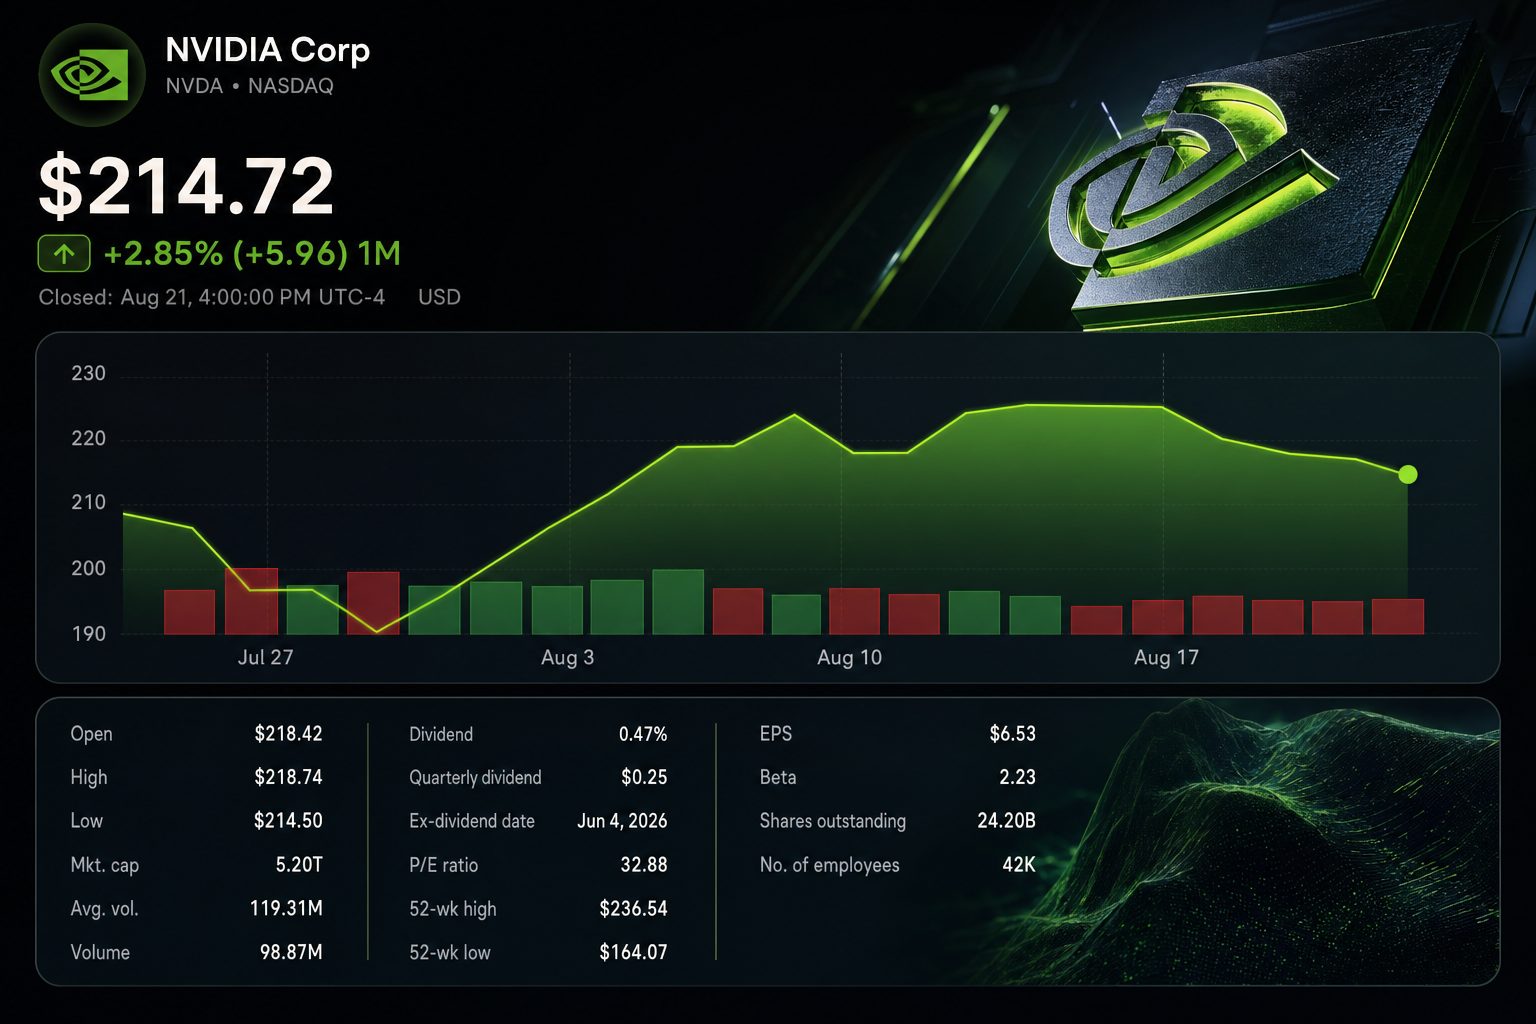
NVIDIA Corporation NASDAQ:NVDA starts earnings week as options markets price in a potential valuation change of about $312 billion. This represents a 6% shift based on Friday’s market capitalization of $5.20 trillion. U.S. markets remain closed on Sunday.
The bar is set high. Analysts project fiscal second-quarter revenue at $92.16 billion, just $1.16 billion, or 1.3%, over Nvidia’s projected midpoint of $91 billion. A standard earnings beat might not be enough for a stock with the world’s highest market valuation.
A new price indication increases pressure. Nvidia has informed key customers that prices for AI servers are expected to go up by over 15% due to higher memory expenses, according to reports. The price hikes would apply to systems delivered from early 2027. Nvidia declined to comment on the report.
| Q2 earnings hurdle | Expected | Comparison | Growth / gap |
|---|---|---|---|
| Revenue | $92.16 billion | $91.0 billion company forecast | +1.3% |
| Revenue | $92.16 billion | $46.7 billion, Q2 FY26 | +97% |
| Adjusted EPS | $2.09 | $1.05, Q2 FY26 | +99% |
| Data Center revenue | $85.67 billion | $41.1 billion, Q2 FY26 | +108% |
The price report leaves Wednesday’s quarter unaffected. Focus turns instead to outlook and gross margin. Systems with greater memory capacity can justify higher selling prices and also entail costlier inputs.
| Gross-margin sensitivity | Quarterly gross-profit impact | Part of options move implied |
|---|---|---|
| 0.5 percentage point | $461 million | 0.15% |
| 1.0 percentage point | $922 million | 0.30% |
| 2.0 percentage points | $1.84 billion | 0.59% |
| 6% equity change | — | $312 billion market value |
A single percentage point of gross margin represents approximately $922 million in quarterly gross profit based on consensus revenue. This is significant on an operating scale, but remains modest compared to the valuation shifts anticipated by options traders.
Investors scaled back positions ahead of the event. Nvidia dropped 4.64% over the past week, finishing at $214.72 per share. The drop wiped out an estimated $253 billion in market capitalization, based on an unchanged number of shares. The Philadelphia semiconductor index slipped roughly 5% as bond yields climbed.
| NVDA last week | Close | Daily move | Volume |
|---|---|---|---|
| Aug. 17 | $225.01 | -0.07% | 93.68 million |
| Aug. 18 | $219.74 | -2.34% | 103.13 million |
| Aug. 19 | $217.56 | -0.99% | 96.80 million |
| Aug. 20 | $216.85 | -0.33% | 92.46 million |
| Aug. 21 | $214.72 | -0.98% | 91.59 million |
The broader economic environment is significant. The 30-year Treasury yield climbed to its highest point since 2007 last week. Rising borrowing costs may hinder data center developments that drive demand for chips. Fed Chair Kevin Warsh’s appearance at Jackson Hole introduces another potential rate driver.
Checks on demand are holding steady. Jefferies analyst Blayne Curtis anticipates a “beat and raise” quarter, pointing to strength in cloud and ongoing demand for committed compute. Curtis also noted that any likely upside seems broadly anticipated. Jefferies note
Nvidia’s previous results established the benchmark. First-quarter revenue totaled $81.6 billion, an 85% increase. Data Center revenue jumped 92% to $75.2 billion. Chief Executive Jensen Huang stated the growth in AI-factory construction was “accelerating at extraordinary speed.” Nvidia Q1 results
| Analyst | Recommendation | Price Target | Potential Upside from $214.72 |
|---|---|---|---|
| BMO Capital | Outperform | $340 | 58% |
| RBC Capital | Outperform | $300 | 40% |
| Morgan Stanley | Overweight | $288 | 34% |
| Oppenheimer | Outperform | $265 | 23% |
| Stifel | Buy | $282 | 31% |
| 62-analyst consensus | Strong Buy | $304.73 average | 42% |
Analysts continue to hold a positive outlook, though targets are not guiding near-term trades. Options pricing indicates a likely post-report range between $201.84 and $227.60. Hitting the upper boundary would simply bring Nvidia back to the intraday range reached last Monday.
The next key test comes after the market closes on Wednesday. Investors are looking for revenue figures to exceed expectations, steady margin forecasts, and confirmation that Vera Rubin is progressing as planned. Updates regarding 2027 pricing and customer financing may weigh as significantly as the top-line earnings per share.
Risks: Industry sources say higher server prices could be driven by rising costs, not improved chip profitability. Any slowdown in AI-related spending, postponed deployments, export restrictions or shrinking margins may point to the downside possibilities. Strong expectations reduce tolerance for uncertainty.
Related articles: NASDAQ:NVDA