
NEW YORK, August 27, 2026, 15:27 (ET)
- U.S. copper prices hovered around $6.58 per pound, approximately 3.7% under the record set in August.
- COMEX warehouse inventories reached an all-time high of 675,185 metric tons, marking 46 consecutive days of gains.
- LME inventories hovered around 90,000 tons as metal was shipped to the United States.
Copper held close to all-time highs on Thursday, with speculation over a potential U.S. tariff drawing physical metal into domestic storage facilities. This trend has increased the significance of regional shortages compared to the worldwide supply outlook.
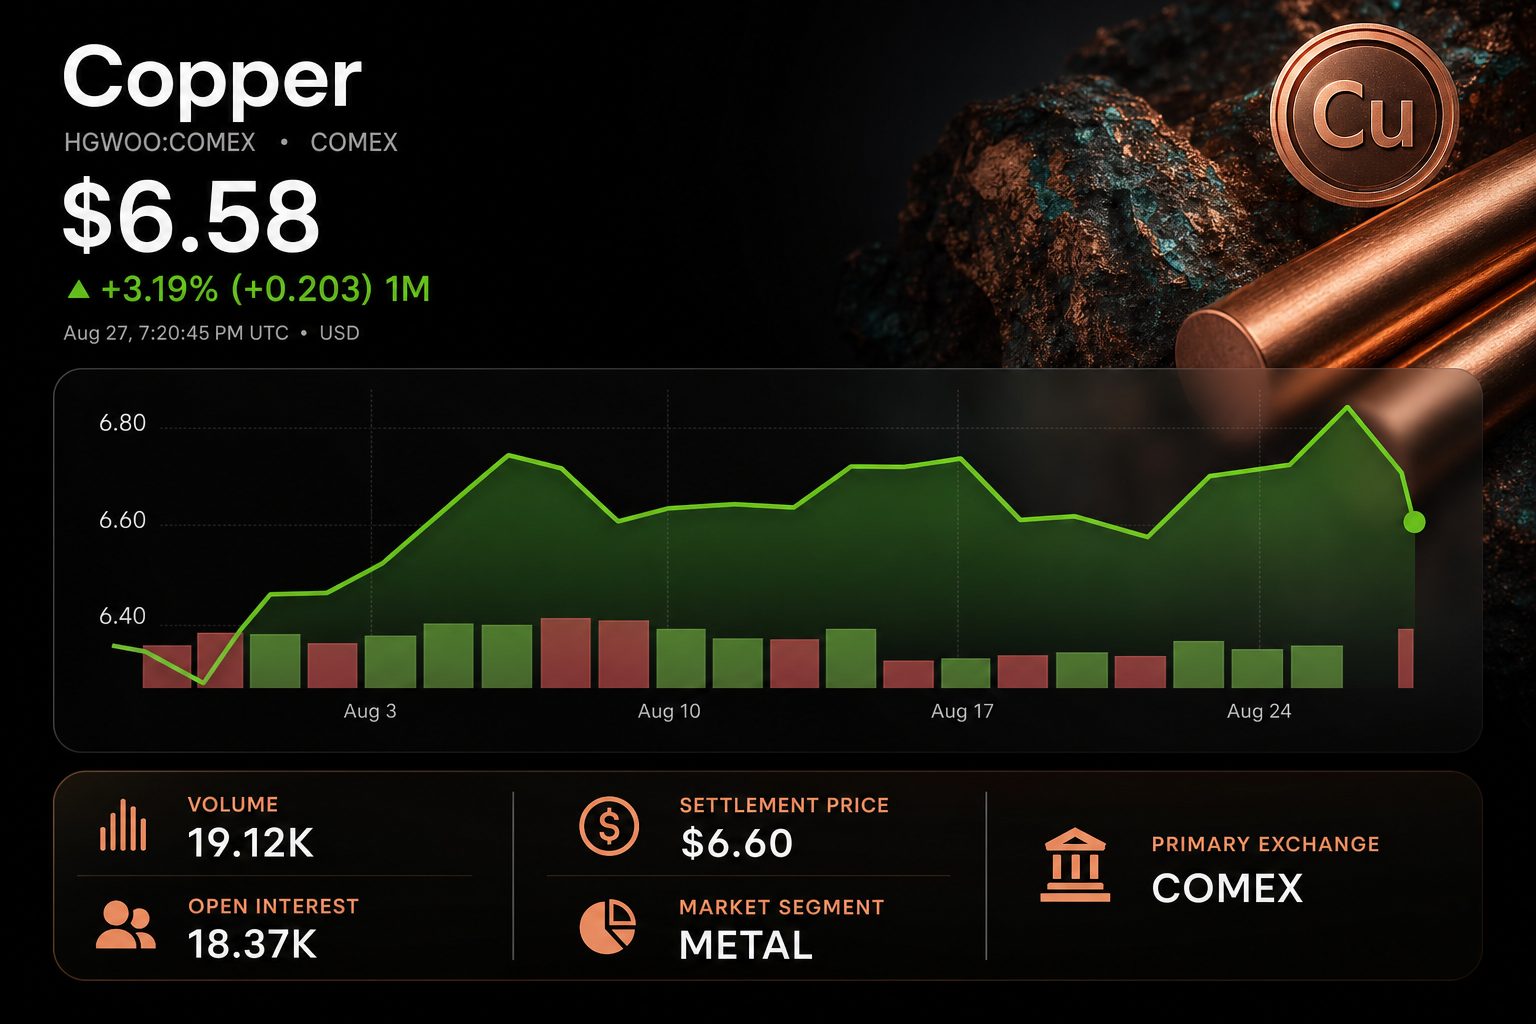
The U.S. benchmark traded close to $6.58 per pound as of 15:27 ET. While it slipped roughly 0.25% for the session, it showed a 4.05% gain over one month and was up 47.25% compared to the same point a year ago current copper data.
London presents the story in a different way. On Tuesday, three-month copper climbed to $14,343 a metric ton, sitting just 1.3% under the record of $14,527.50 set in January. The increase was spurred by requests to remove 65,400 tons from LME warehouses Reuters.
| Market measure | Latest verified reading | Investor signal |
|---|---|---|
| U.S. copper reference | $6.58/lb on Aug. 27 | One-month increase of 4.05% |
| LME three-month high | $14,343/ton on Aug. 25 | 1.3% under the all-time high |
| COMEX inventory | 675,185 tons | All-time record; increased 46 consecutive days |
| Available LME inventory | About 90,000 tons | Limited regional supplies |
| Potential U.S. duty | 15% in 2027; 30% in 2028 | Drives importing |
The disparity is significant. COMEX inventories are about 7.5 times greater than the LME’s immediately accessible stocks. Since this metal is duty-paid and expensive to transport back, its utility beyond the U.S. remains limited.
U.S. imports of refined copper totaled nearly 885,000 tons in the first six months, up 3% from the prior year and exceeding twice the pace seen in 2024. Imports for the entire year reached a record 1.64 million tons in 2025.
A change in inventory could eliminate the notional surplus. CRU previously forecast a global surplus of 639,000 tons for 2026. However, its analyst now says the accessible market would be balanced if U.S. stockpiles stay off the market.
The key driver is the pending policy decision. Washington was weighing a 15% tariff on refined copper from January 1, 2027, which could increase to 30% in 2028.
The uncertainty directly affects valuations. When copper prices climb, mining companies benefit from increased revenue, while sectors like power equipment, construction, and data-center projects contend with higher material costs. Copper remains the primary U.S. standard for managing such risk exposure CME Group.
U.S.-traded copper stocks moved in different directions on Thursday. Freeport-McMoRan (NYSE: FCX) dropped 0.34% to $78.73 as of 15:13 ET. Southern Copper (NYSE: SCCO) advanced 1.56% to $217.08, and the Global X Copper Miners ETF (NYSEARCA: COPX) was up 0.84% at $96.34.
Long-term supply growth is lagging. Argentina and Chile have reinstated a cross-border framework, potentially opening the way for $20.7 billion in investment and an increase of 540,000 tons in yearly output. Authorities did not specify a schedule for implementation Reuters.
Short-term pressures are pressing. LME stocks have dropped significantly since mid-May. Supply has also been squeezed outside U.S. warehouses by mine disruptions and a smelter shutdown in Indonesia.
Risks: The U.S. premium could drop rapidly if tariffs are lifted or there is a decisive policy move. High COMEX inventories, softer demand from China, or investors selling off positions would further weigh on prices. Elevated copper prices might also hold back industrial buying.
The key issue is not a lack of supply, but rather its location. With policy still uncertain, investors are valuing copper based on the difficulty of getting the metal to those who require it.
Related articles: Commodities