

New York, August 31, 2026, 03:31 (EDT)
- Nu Holdings ended Friday at $14.30, falling 3.90%, with 79.13 million shares changing hands.
- Net income for the second quarter hit a record $1.06 billion, surpassing the Visible Alpha forecast of $967.2 million.
- The proportion of loans overdue by more than 90 days increased by 35 basis points from the previous period, reaching 6.9%.
- Of nine analyst ratings issued lately, six are buys, two are holds, and one is a sell.
Nu Holdings Ltd. (NYSE: NU) lost 3.9% on Friday, with investors focusing on its all-time high profit alongside an uptick in late-stage delinquencies. Shares finished at $14.30 at 16:00 EDT.
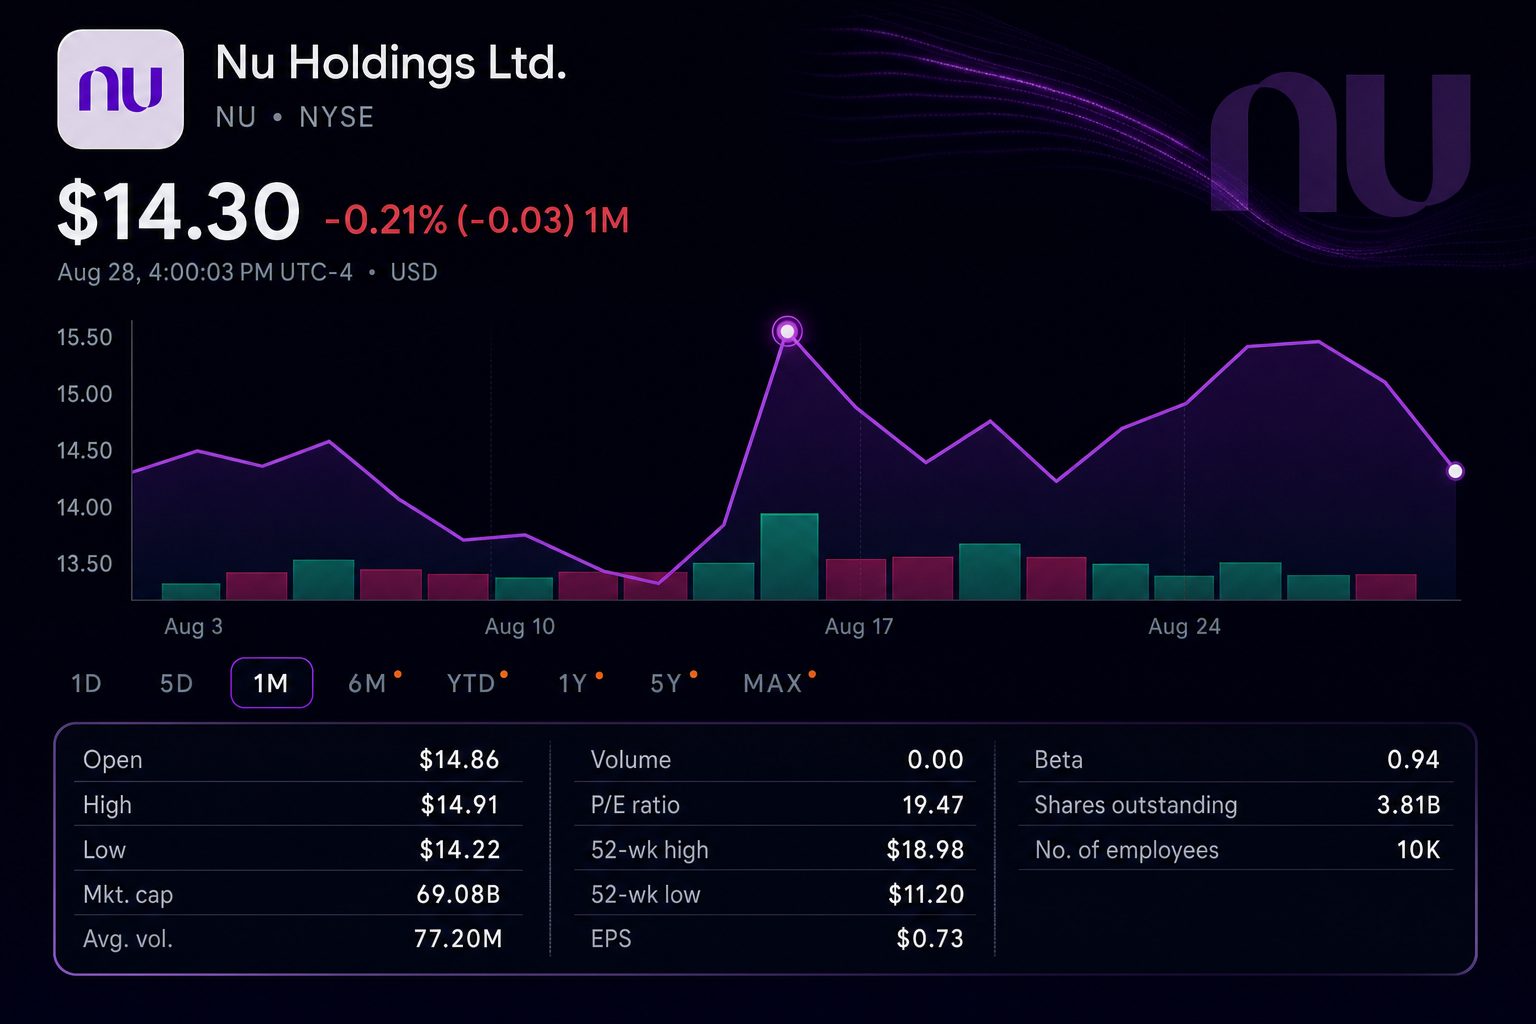
The drop wiped out around $2.8 billion in market capitalization. Nu’s valuation now stands close to $69.1 billion, which is about 19.5 times its trailing earnings Google Finance.
Trading volume totaled 79.13 million shares, just above the typical average of 77.20 million. Shares rose 0.14% in after-hours trading, closing at $14.32 StockAnalysis market data.
The decline came after a robust response to earnings two weeks prior. Nu posted second-quarter profit of $1.06 billion, marking a 49% increase at constant currency and surpassing the $967.2 million forecast Reuters.
Gross revenue increased by 39% to $5.88 billion. The risk-adjusted net interest margin climbed to 12.4%, up from 9.5% in the prior quarter.
Credit quality showed mixed trends. Early-stage delinquencies declined to 4.8%, but the percentage of loans overdue by more than 90 days increased to 6.9% Nu second-quarter results.
The distinction is significant as late-stage arrears have the potential to impact upcoming provisions. Nu’s credit portfolio reached $39.4 billion, up 37% compared to the previous year.
Deposits totaled $45.3 billion, representing a 1.15x buffer over outstanding loans. Overall deposit costs held steady at 88% compared to interbank rates.
Operating leverage continues to be underpinned by customer growth. Nu’s customer base expanded by approximately four million, totalling 139 million in Brazil, Mexico and Colombia.
| Investor metric | Q2 2026 | Prior comparison | Change |
|---|---|---|---|
| Net income | $1.06 billion | $871 million in Q1 | +17% from previous quarter |
| Gross revenue | $5.88 billion | Q2 2025 | +39% year-on-year |
| Risk-adjusted NIM | 12.4% | 9.5% in Q1 | Up 290 bps |
| 90+ day NPL ratio | 6.9% | 6.55% in Q1 | Increase of 35 bps |
| 15–90 day NPL ratio | 4.8% | About 5.0% in Q1 | Better |
Costs need attention. The efficiency ratio increased to 19.5%, up from 17.6%, as expenditures on property, marketing, and international growth climbed.
Analysts maintain an optimistic outlook, though opinions on valuation vary. Out of nine recent ratings, six are buys. The average price target stands at $17.47, with estimates ranging between $10 and $23 Google Finance analyst data.
The upcoming scheduled company event is third-quarter earnings, set for November 12. Prior to that, Brazil’s policy meeting on September 14–15 will examine the rate environment affecting loan volume and cost of funding Banco Central do Brasil.
Risks: Accelerated credit growth may increase defaults and provisions. Weakness in currency, ongoing high rates in Brazil, elevated expansion expenses, and operational challenges in Mexico, Colombia, and the United States could weigh on returns.
Related articles: NYSE:NU