
SÃO PAULO, August 30, 2026, 12:50 EDT
- Nu closed Friday at $14.30, down 3.9%, on 79.1 million shares.
- The move erased about $2.8 billion of market value.
- Second-quarter net income reached $1.1 billion, while 90-day-plus delinquencies rose to 6.9%.
- Analysts’ average $18.40 target implies 28.7% upside.
Nu Holdings Ltd. (NYSE: NU) fell 3.9% to $14.30 on Friday. The decline erased about $2.8 billion from its equity value.
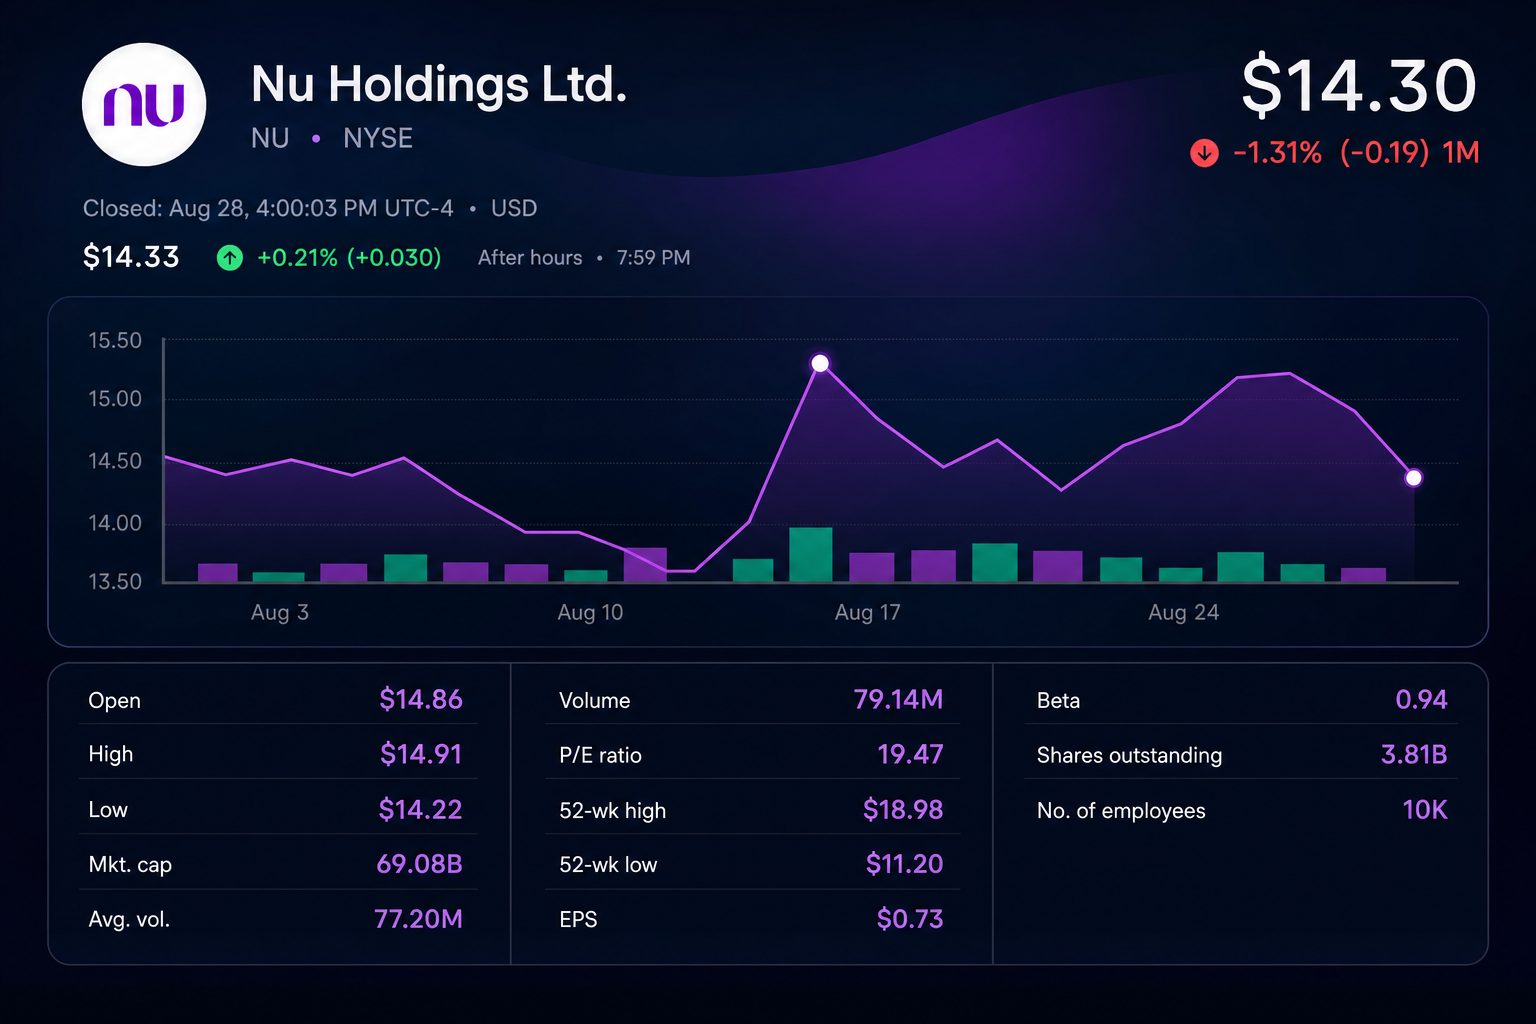
Trading reached 79.1 million shares, 3% above the 65-day average. The broader financial-services group was nearly flat, making the underperformance company-specific rather than a sector move WSJ market data.
The selloff tests a sharp earnings-versus-credit split. Nu produced record quarterly net income of $1.1 billion, yet its mature-delinquency ratio rose 35 basis points sequentially to 6.9%.
| Investor measure | Latest reading | Comparison |
|---|---|---|
| Share price | $14.30 | -3.9% Friday; -3.1% for the week |
| Volume | 79.1 million | 103% of 65-day average |
| Q2 gross revenue | Nearly $5.9 billion | +39% year over year, FX neutral |
| Q2 net income | $1.1 billion | +49% year over year, FX neutral |
| Credit portfolio | $39.4 billion | +37% year over year, FX neutral |
| 90-day-plus NPL ratio | 6.9% | +35 basis points sequentially |
| Return on equity | 33% | Q2 2026 |
Nu’s credit portfolio expanded 37% from a year earlier to $39.4 billion. Deposits grew 18% to $45.3 billion, leaving a useful funding cushion as lending scaled.
Near-term stress improved. Loans 15 to 90 days past due fell 16 basis points to 4.8%, and the cost of credit declined 9% from the first quarter.
Older arrears moved the other way. That 6.9% late-stage ratio matters because it captures weaker borrowers migrating through the book.
Profitability still provides room. Net interest margin climbed 180 basis points to 22.9%, while risk-adjusted margin rose to 12.4% from 9.5% Nu’s second-quarter results.
Customer count reached 139 million after four million additions during the quarter. Average monthly revenue per active customer held near $17, with activity at 83.5%.
At Friday’s close, Nu trades at about 16.4 times the $0.87 consensus 2026 earnings estimate. The multiple drops to 12.7 times the $1.13 estimate for 2027.
Wall Street remains constructive. Seventeen of 22 tracked analysts rate the shares Buy, three Hold and two Underweight. Their average target is $18.40, with a $19 median.
The next test is third-quarter reporting, currently expected on November 12. Consensus calls for $0.23 per share, up from $0.22 in the second quarter.
Risks: Brazilian rates, currency moves and unemployment can change repayment behavior quickly. Faster loan growth could also lift provisions before customer revenue catches up.
Friday’s decline therefore resets the price, not the debate. Investors must decide whether expanding margins can keep absorbing a still-rising stock of late-stage delinquencies.
Related articles: NYSE:NU