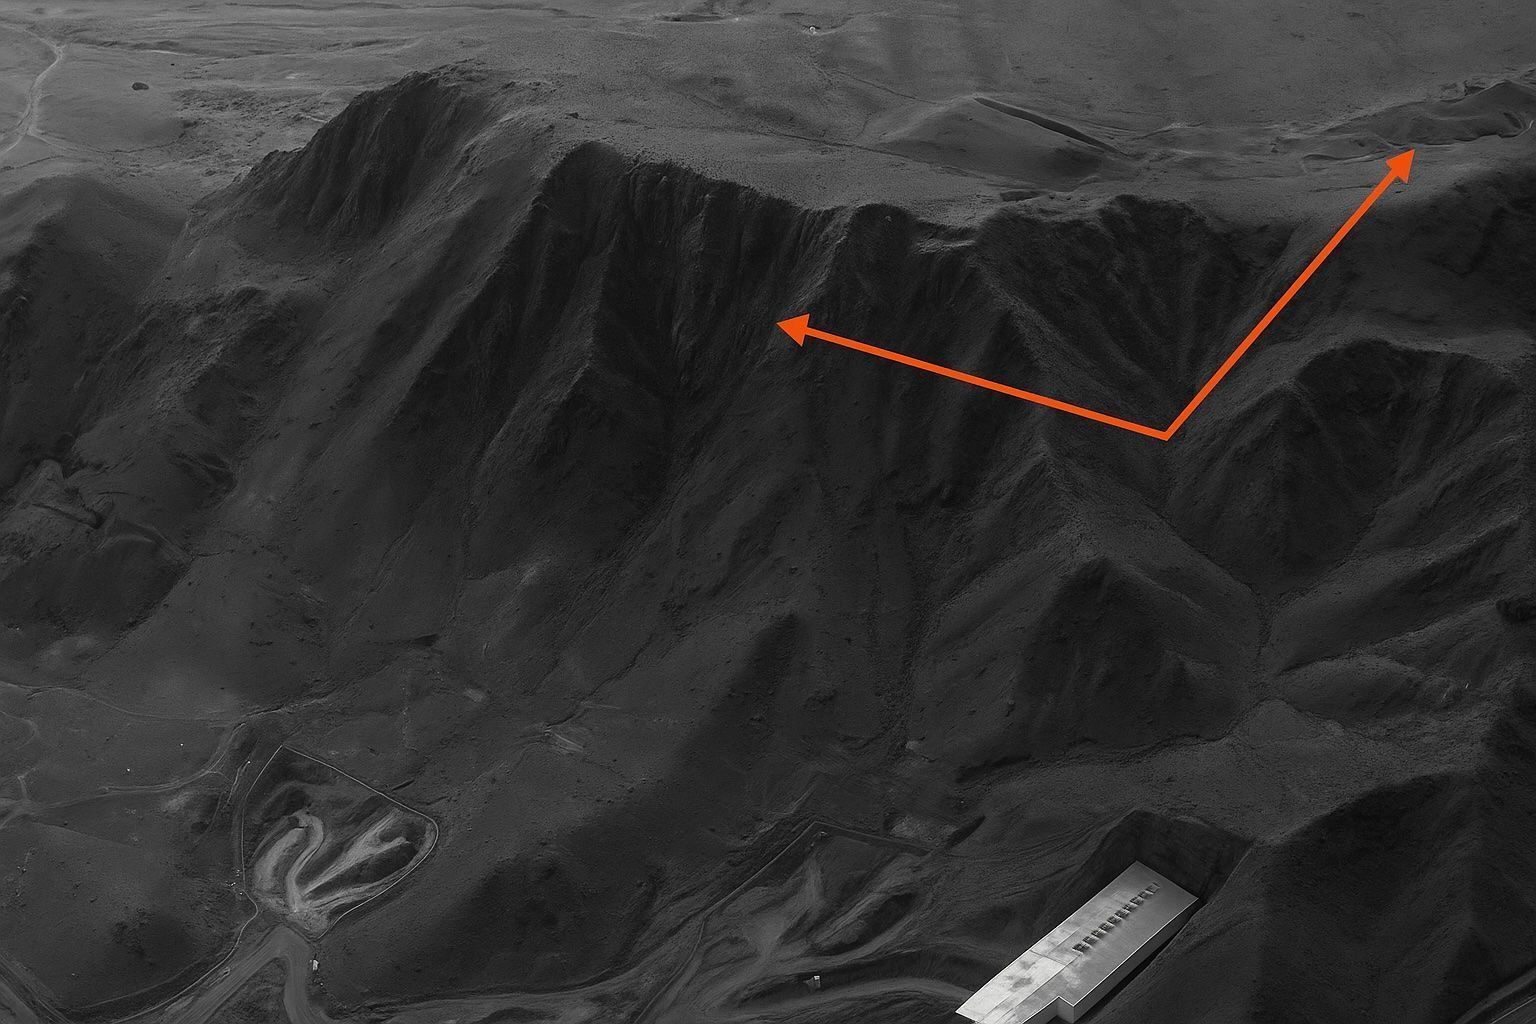
- On 22 June at 10:22 UTC, Maxar released 0.5-meter imagery showing three circular Fordow blast scars about 25 meters across at the portal area.
- Planet Labs’ SkySat captured higher-cadence shots showing eastward dust clouds and bulldozers arriving by noon local time.
- Five classic penetrator indicators are visible in Fordow imagery: entry craters, radial debris ejection, thermal scarring, rock-face fracturing, and surface subsidence, including uphill fissures and an 8-meter cavity collapse.
- The Fordow centrifuge galleries are estimated at 80–100 meters deep, leaving uncertainty about complete destruction.
- Fordow produced 166 kilograms of 60 percent enriched uranium-235 in the last quarter, nearly enough for four bomb cores.
- Natanz shows a ruined power substation and emergency generators, while Isfahan’s Uranium Conversion Facility lost four key buildings, halting UF6 production.
- The IAEA reported no off-site radiation contamination and no unusual gamma spikes within 24 hours, and UF6 storage remains a chemical hazard rather than radiological.
- OSINT moved faster than classified spying, with Fordow imagery appearing on social media within six hours of the strike and widely echoed by outlets.
- Analysts say next actions could include concrete pours to seal portals or excavating new adits, with daily commercial satellite revisits critical to track changes.
- The article argues that satellite imagery has become the world’s fastest war correspondent and its most indisputable fact-checker, shaping the Fordow narrative and potential outcomes.
A cascade of newly released commercial‑satellite photographs confirms that last weekend’s U.S. bunker‑buster raid on Iran’s Fordow enrichment plant gouged fresh holes into the mountain and triggered a landslide of rock and debris that experts say may have entombed the centrifuge halls. The imagery—captured by Maxar, Planet Labs and others—has become the centerpiece of a fast‑moving open‑source intelligence (OSINT) effort that is mapping the strike’s true impact long before inspectors set foot on site. Below is an in‑depth report that pieces together what the pixels show, what analysts and officials are saying, and what it means for the future of Iran’s nuclear program.
Key Findings (Executive Summary)
- High‑resolution pictures taken hours after the raid show at least three fresh blast funnels on the western slope of the Fordow mountain and new subsidence fractures running uphill—visual signatures consistent with the 30,000‑lb GBU‑57 Massive Ordnance Penetrator (MOP). jpost.comwtop.com1
- Imagery analysts from Maxar, Planet and the Institute for Science and International Security (ISIS) agree that “multiple tunnel portals are now sealed by collapse,” though the depth of the centrifuge galleries (80‑100 m) leaves uncertainty about complete destruction. ts2.tech1
- The same satellite constellations show heavy structural damage at Natanz and Isfahan, where power‑conversion, uranium‑metal and sub‑station buildings lie in rubble, corroborating IAEA field‑radiation data that still registers “no off‑site contamination.” aljazeera.comreuters.com1
- OSINT has eclipsed classified spying as the fastest feedback loop in this crisis: images appeared on social media within six hours of the bombs, long before Tehran or Washington issued detailed statements. nbcphiladelphia.com2
- Experts warn that new pictures alone cannot measure internal shock damage; Fordow’s cascade halls could be ‘frozen’ for months or merely idle for repairs. ts2.tech3
1. How Satellite Eyes Caught the Blows in Real Time
1.1 The Imagery Providers
- Maxar Technologies released 0.5‑m imagery at 10:22 UTC on 22 June showing three circular blast scars, each roughly 25 m across, at the Fordow portal area. 4
- Planet Labs’ SkySat captured higher‑cadence shots that revealed dust clouds drifting east and bulldozers arriving by noon local time. aljazeera.com1
- Reuters graphics stitched the sequences into an interactive before/after slider, giving the clearest public measure of crater depth and portal blockage. 1
1.2 Forensic Clues in the Pixels
Analysts look for five classic indicators of penetrator strikes: entry craters, radial debris ejection, thermal scarring, rock‑face fracturing and surface subsidence. All five appear in the Fordow images: subsidence fissures snake up the ridge, and shadow analysis indicates cavity collapse of at least 8 m. haaretz.com5
2. What the Experts Say
| Expert | Affiliation | Quote |
|---|---|---|
| David Albright | Institute for Science and International Security | “There’s no proof yet that the underground halls are pulverized, but de‑powering alone can freeze Fordow for months.” ts2.tech |
| Rafael Grossi | IAEA Director‑General | “No increase in off‑site radiation levels has been reported… The Board will meet in emergency session Monday.” apnews.comiaea.org |
| Andreas Krieg | King’s College London | “Even America’s heaviest bunker‑busters may struggle with Iran’s deepest galleries; a follow‑on commando phase cannot be ruled out.” reuters.com |
| Stephen Zunes | Univ. of San Francisco | Warns of a “cycle of escalation” dragging U.S. troops and bases into Iran’s retaliation envelope. aljazeera.com |
| Adam Weinstein | Quincy Institute | Predicts Tehran will push enrichment “further underground and further out of sight,” risking NPT withdrawal. aljazeera.com |
3. Inside Fordow: Why It Was the Hardest Nut to Crack
- Fordow’s centrifuge halls sit 80–100 m below solid limestone, well beyond the reach of Israel’s GBU‑28 but vulnerable to the U.S. MOP carried by B‑2 Spirits. 1
- Prior Israeli raids (13 June) damaged Natanz and Isfahan, but left Fordow largely intact, prompting Washington’s intervention. reuters.com6
- Fordow produced 166 kg of 60 % U‑235 last quarter—nearly four bomb cores—making it the strategic priority. 1
4. Natanz & Isfahan: Satellite Snapshots of a Systemic Knock‑Out
- At Natanz, Maxar imagery shows the power‑substation and emergency generators in ruins; Grossi told the UN that centrifuges were “likely destroyed altogether.” reuters.com1
- Isfahan’s Uranium Conversion Facility lost four key buildings, halting UF₆ production; conversion is the “feedstock bottleneck,” meaning Iran could soon run out of gas for enrichment. 1
- Reuters’ interactive graphics overlay pre‑strike and post‑strike visuals, giving a public audit trail of the damage. 1
5. Environmental & Radiological Impact
- The IAEA, using its regional monitoring network, “detected no unusual gamma spikes” within 24 hours. reuters.com7
- Experts note enrichment plants primarily store UF₆, a chemical hazard rather than a high‑level radiological one; the real nightmare would be a hit on Bushehr’s reactor core. 8
6. The OSINT Revolution: Why Commercial Satellites Now Shape the Narrative
- Speed of Disclosure: first Fordow images hit X (formerly Twitter) six hours post‑strike, outpacing both Tehran’s denial and Trump’s victory speech. nbcphiladelphia.com9
- Public Verification: media outlets from Haaretz to Newsweek embedded the imagery, forcing officials to address concrete evidence rather than rhetoric. haaretz.com10
- Democratized Analysis: academic labs and armchair sleuths triangulated crater size and tunnel vectors, illustrating how satellite OSINT has become a crowd‑sourced watchdog. facebook.com11
7. Strategic Fallout
- Iranian response: ballistic‑missile salvos on Israeli cities and threats against U.S. bases—moves already visible in fresh overhead tracking the repositioning of U.S. carrier groups and tanker fleets. reuters.com1
- Diplomacy stalled: Western mediation collapsed; UN Secretary‑General Guterres calls the strikes a “dangerous escalation.” 9
- Program setback vs. knowledge retention: Physical damage may delay enrichment, but Tehran’s scientific base remains—highlighting a persistent “rebuild vs. restrike” dilemma. reuters.com1
8. Outlook: What the Next Images Could Show
Commercial constellations will revisit Fordow daily; analysts expect to see either (1) concrete‑pour teams sealing portals, signaling abandonment, or (2) excavation gear carving new adits, signaling a dig‑out and rebuild strategy. Any sudden appearance of ventilation stacks or power lines rerouted around the crater zones will be pivotal clues. Continued OSINT vigilance—paired with IAEA ground truth—will determine whether June 2025 marks the permanent crippling of Iran’s hardest nuclear site or merely the opening round of an even deeper subterranean arms race.
Bottom Line: In an age where every conflict zone is under continuous orbital watch, satellite imagery has become both the world’s fastest war correspondent and its most indisputable fact‑checker. The Fordow “crater chronicles” show that whoever controls the pixels often controls the narrative—and, potentially, the strategic outcome.


