
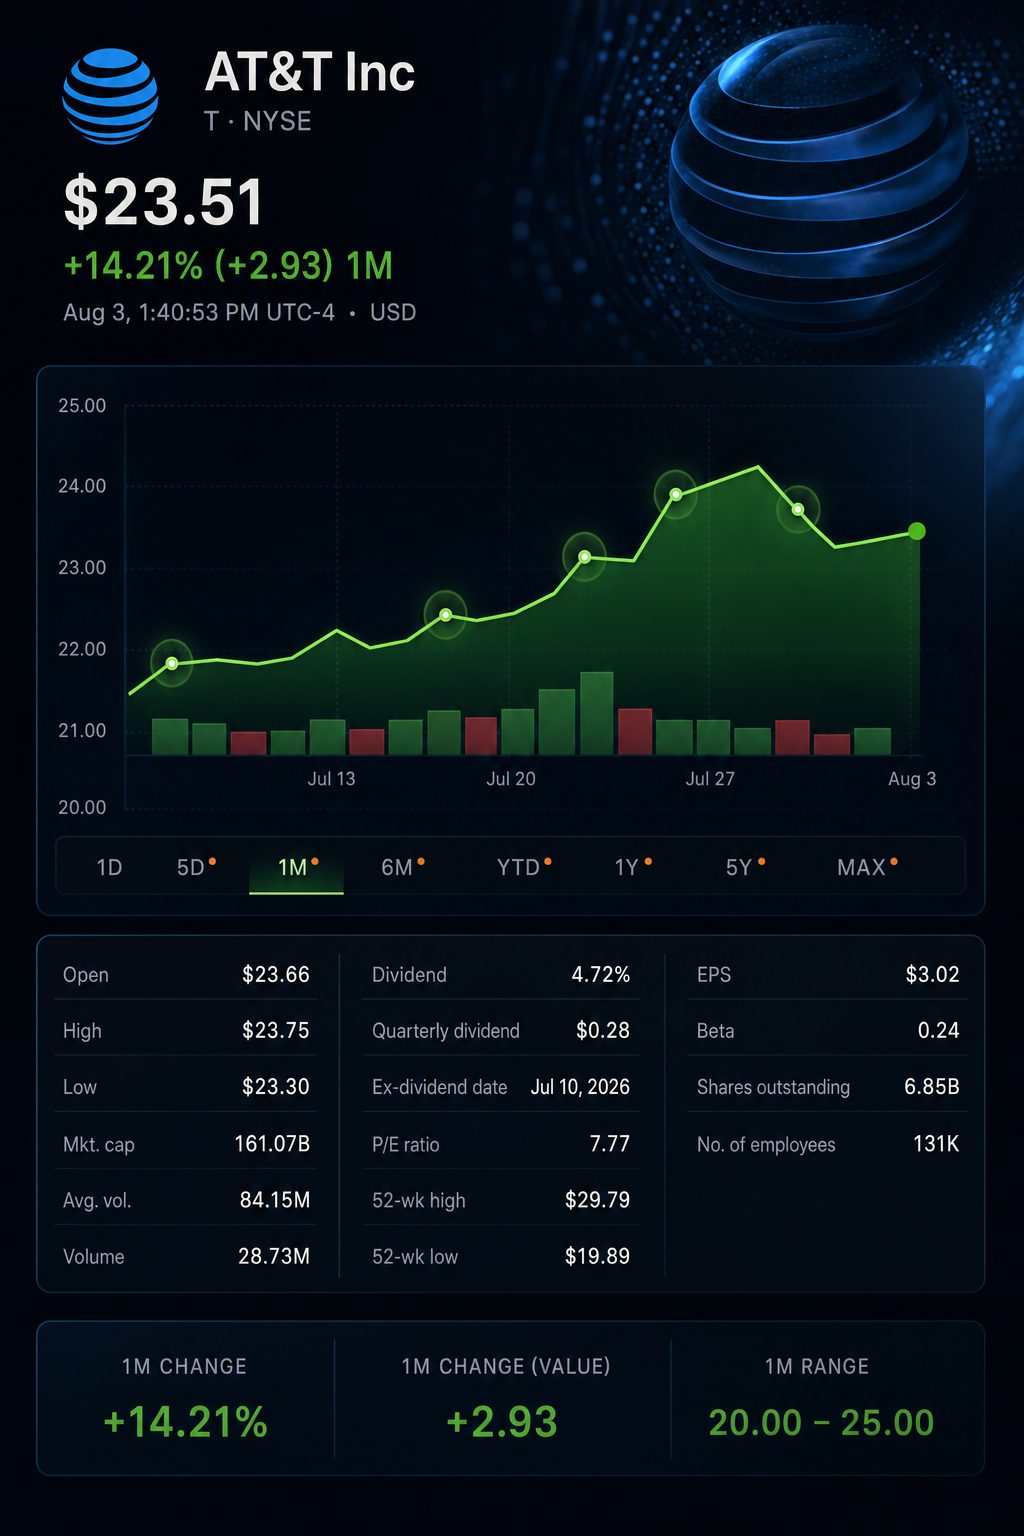
NEW YORK, August 3, 2026, 13:20 EDT — AT&T shares rose, with the lower price per share set to increase the potential effectiveness of the company’s ongoing buyback program.
- AT&T Inc. NYSE:T was up 1.2% at $23.52 during U.S. market hours.
- The price was 7.7% lower than AT&T’s average repurchase price in the first half.
- Initial reporter calculations show that dividends and buybacks account for 97.8% of AT&T’s minimum projected free cash flow for 2026.
AT&T gained on Monday, but remained under the price it has been paying in its buyback program. At this price, every dollar used for repurchases removes roughly 8.4% more shares.
By the end of June, AT&T had invested $4.435 billion to acquire about 174 million shares. This suggests an average cost per share of roughly $25.49, not including fees and excise tax.
The price stood at $23.52 as of 13:05 EDT. This enhances the efficiency of repurchases going forward, though prior purchases remain, on average, below water.
Market snapshot within the session
| Company | Price | Day move | Market value | Trailing P/E |
|---|---|---|---|---|
| AT&T Inc. NYSE:T | $23.52 | up 1.2% | $163.4 billion | 7.8 |
| Verizon Communications Inc. NYSE:VZ | $47.23 | up 0.9% | $197.0 billion | 12.3 |
| T-Mobile US Inc. NASDAQ:TMUS | $176.28 | up 2.1% | $190.7 billion | 18.4 |
Prices as of about 13:05 EDT. Percentage changes reflect quoted shifts from previous closing values.
AT&T had the lowest earnings multiple among the group. Its stated annual buyback plan also represented the largest proportion relative to market value.
Extent of buyback
| Company | Disclosed repurchase figure | Period | Percentage of current market value |
|---|---|---|---|
| AT&T | Roughly $10.0 billion | 2026 plan | 6.1% |
| Verizon | Maximum $4.5 billion | 2026 target | 2.3% |
| T-Mobile | $2.2 billion | Second quarter actual | 1.2% |
AT&T and Verizon numbers refer to yearly goals. T-Mobile’s number refers to a single quarter and has not been adjusted to an annual basis.
AT&T’s buyback volume for the year was 2.7 times that of Verizon, amplifying the effect on its share count as well as increasing execution risk.
Prior to the July transactions, $5.565 billion was left to meet AT&T’s 2026 goal. At a share price of $23.52, this equates to 236.6 million shares, or 3.5% of AT&T’s outstanding shares as of July 16. The final number of shares repurchased may be different.
Assessing AT&T’s liquidity and funding
| Item | Amount | Percentage of $18 billion FCF floor |
|---|---|---|
| 2026 minimum free cash flow | $18.00 billion | 100.0% |
| Annualized common dividend | $7.61 billion | 42.3% |
| 2026 buyback goal | About $10.00 billion | 55.6% |
| Total distributions to shareholders | $17.61 billion | 97.8% |
| Remaining at guidance floor | $0.39 billion | 2.2% |
| Draw on spectrum term loan | $14.50 billion | 80.6% |
| Cost of spectrum purchase | $23.00 billion | 127.8% |
Initial journalist calculations are based on 6.852 billion shares in circulation as of July 16. The projected dividend will drop as additional shares are bought back. Loan and purchase totals indicate magnitude, rather than planned usage of free cash flow.
At the lower end of the guidance, standard returns yield approximately $394 million prior to preferred dividends and fees. AT&T could surpass its projected $18 billion in cash flow. However, the starting margin remains slim.
Chief Executive John Stankey said, “We are accelerating the pace of our planned share repurchases this year to approximately $10 billion.” In the second quarter, AT&T returned $4.1 billion, which included $2.2 billion from buybacks of common stock. AT&T Newsroom
The balance-sheet test became stricter following the spectrum deal close on July 28. AT&T accessed $14.5 billion through two term-loan facilities, covering the rest of the payment in cash.
As of June 30, net debt amounted to $126.4 billion, prior to closing. AT&T anticipates that its net debt-to-adjusted EBITDA ratio will approach 2.5 times in roughly three years.
The plan is backed by the operating base. AT&T recorded 432,000 postpaid phone net adds, surpassing the FactSet projection of 338,500. Advanced internet net adds totaled 646,000, and free cash flow for the quarter stood at $4.7 billion.
“The cross-selling they have been developing is now evident in the figures,” said David Wagner, who leads equity at Aptus Capital Advisors, a holder of AT&T stock. Reuters
Operating performance in the second quarter compared
| Company | Reported postpaid metric | Relevant service-revenue growth | Quarterly free cash flow |
|---|---|---|---|
| AT&T | 432,000 new net phone additions | Advanced Connectivity: +5.1% | $4.7 billion |
| Verizon | 184,000 new net phone additions | Mobility and broadband: +2.8% | $6.4 billion |
| T-Mobile | 277,000 net account additions | Total service revenue: +9.0% | $4.8 billion, adjusted |
T-Mobile discloses postpaid account figures instead of phone net additions. The companies’ definitions for service revenue also vary.
AT&T surpassed Verizon in reported phone subscriber gains. T-Mobile posted the highest service-revenue growth rate, as Verizon led in quarterly cash generation.
AT&T’s $0.2775 common dividend was also paid out on Monday. The annual payout per share holds steady at $1.11.
Risks: Weaker subscriber growth, intensified price competition or increased borrowing expenses may strain cash flow. Necessary regulatory clearances could push copper-network shutdown past 2029.
AT&T’s buyback calculations benefit from the reduced share price. However, cash generation remains a challenge due to the spectrum-backed balance sheet.
Related articles: NYSE:T



![Australia Stock Market Today 24/08/2026 [UPDATE: 10:38 AEST] [Miners Lift ASX as Banks Blunt Opening Gain]](https://ts2.tech/wp-content/uploads/2026/08/AU-market-dashboard-2026-08-24-1038-480x384.jpg "Australia Stock Market Today 24/08/2026 [UPDATE: 10:38 AEST] [Miners Lift ASX as Banks Blunt Opening Gain]")
![Asia Stock Market Today 24/08/2026 [UPDATE: 09:01 SGT] [Samsung Slides as SK hynix Splits Seoul Chip Trade]](https://ts2.tech/wp-content/uploads/2026/08/Asia-market-dashboard-2026-08-24-0859-480x384.jpg "Asia Stock Market Today 24/08/2026 [UPDATE: 09:01 SGT] [Samsung Slides as SK hynix Splits Seoul Chip Trade]")