
NEW YORK, August 3, 2026, 13:24 EDT
- Nasdaq was open for trading. CoreWeave traded higher at $82.96, rising 15.6%.
- The most recent loan was issued with a 100-basis-point premium over the facility from May.
- Initial assessment: the update increases the annual figure by $26 million to $32.5 million when fully utilized.
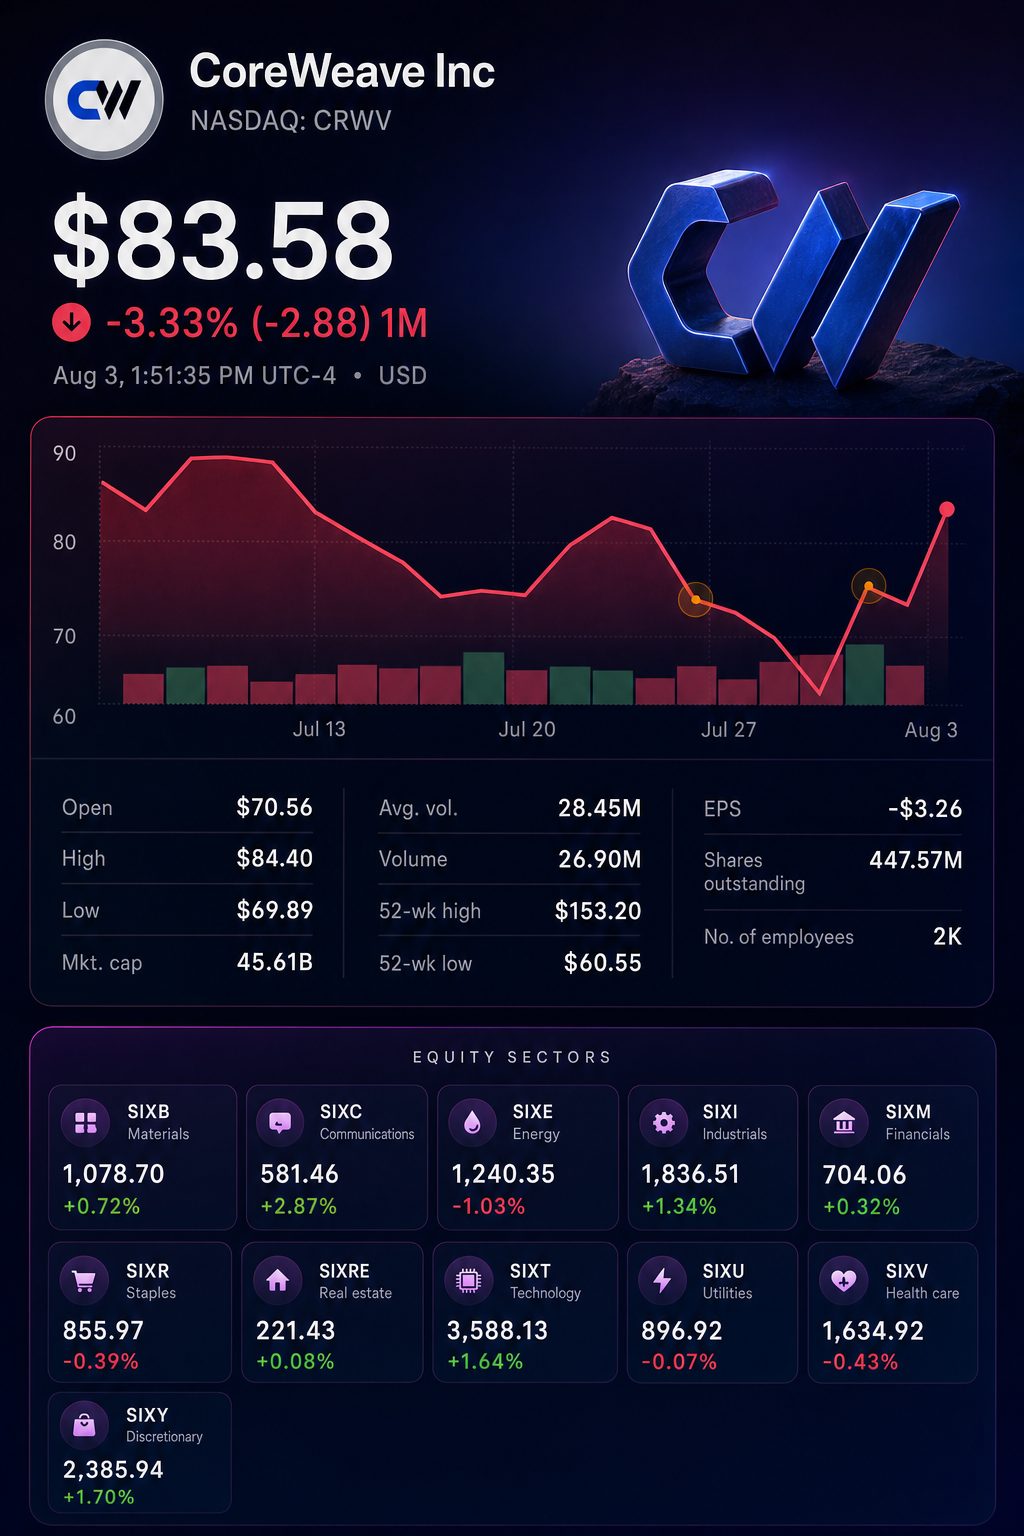
Shares of CoreWeave Inc. NASDAQ:CRWV surged 15.6% to $82.96 on Monday, pushing the company’s market capitalisation to $43.7 billion. Other listed AI-infrastructure companies gained as well.
The rally in shares hides tougher borrowing conditions. The $2.6 billion loan offered last week was priced at SOFR plus 550 basis points. Lenders also secured stricter control over cash.
With the entire amount drawn, the 100–125-basis-point concession increases annual costs by $26 million to $32.5 million. This initial calculation does not factor in base SOFR or the issue discount. The precise expense will vary based on when funds are accessed. The high end comes close to CoreWeave’s stated $32 million rate sensitivity.
| Company | Price | Day change | Intraday range |
|---|---|---|---|
| CoreWeave Inc. NASDAQ:CRWV | $82.96 | up 15.6% | $70.00–$84.36 |
| Nebius Group N.V. NASDAQ:NBIS | $217.09 | up 14.0% | $176.78–$218.74 |
| IREN Ltd. NASDAQ:IREN | $39.19 | up 6.5% | $35.54–$39.70 |
| Applied Digital Corp. NASDAQ:APLD | $29.08 | up 6.2% | $26.14–$29.95 |
| Invesco QQQ Trust NASDAQ:QQQ | $698.40 | up 1.5% | $685.94–$698.69 |
Data reflects market activity as of 13:24 EDT.
CoreWeave surpassed QQQ by 14.1 points. Nebius followed most closely, lagging by 1.6 points.
| Measure | May 2026 facility | Latest $2.6 billion marketing |
|---|---|---|
| Facility size | $3.1 billion | $2.6 billion |
| Spread over SOFR | 450 bps | 550 bps |
| Move during syndication | Tightened by 50 bps | Widened by 100–125 bps |
| Demand | Oversubscribed | Close to $9 billion after adjustments |
| Offer price | Not made public | 96–97 cents |
| Added cash control | Not made public | Lockbox in effect until 50% is paid down |
The facilities vary in terms of customer support, structure, and timing.
The structures differ.
Syndication momentum shifted by 175 basis points at the upper end. May’s transaction closed 50 points tighter. Terms for the most recent deal widened by up to 125 points. Quoted spreads differed by 100 points.
Following adjustments, orders climbed close to $9 billion, amounting to 3.5 times the deal size. A lockbox mechanism directs contract-related funds toward repayment until 50% of the debt is cleared.
| Metric | Q1 2026 | Q1 2025 | Change |
|---|---|---|---|
| Revenue | $2.078 billion | $982 million | up 112% |
| Net interest expense | $536 million | $264 million | up 103% |
| Operating loss | $144 million | $27 million | expanded 5.3 times |
| Adjusted operating income | $21 million | $163 million | down 87% |
| Cash property and equipment purchases | $7.695 billion | $1.407 billion | increased 5.5 times |
Debt increased by 16.3%, reaching $24.9 billion in the first quarter, amounting to 56.9% of Monday’s equity value. Cash declined by 28.2% to $2.24 billion.
Interest expense climbed by 103%, close to the 112% increase in revenue. Net interest amounted to 25.8% of sales.
Chief Executive Michael Intrator described the period as “the strongest bookings quarter in CoreWeave’s history.” The company’s backlog climbed to $99.4 billion. However, adjusted operating margin slipped to 1% from 17%. CoreWeave
Spending on property and equipment in cash totaled $7.70 billion, 5.5 times higher than the same period last year. The expenditure was 3.7 times the company’s quarterly revenue.
| Measure | Q2 2026 guidance | FY2026 guidance |
|---|---|---|
| Revenue | $2.45–$2.60 billion | $12–$13 billion |
| Adjusted operating income | $30–$90 million | $900 million–$1.1 billion |
| Interest expense | $650–$730 million | Not provided |
| Capital expenditures | $7–$9 billion | $31–$35 billion |
Corporate outlook released on May 7.
Based on guidance midpoints, interest for Q2 amounts to 27.3% of revenue. Capital expenditure is 3.2 times revenue. The adjusted operating margin stands near 2.4%.
Full-year projections are still weighted toward capital expenditure. The midpoint for capex stands at $33 billion, equal to 2.64 times projected revenue. Backlog amounts to almost eight times the $12.5 billion midpoint for sales. Monday’s equity value represents 3.5 times that sales midpoint.
Risks: Funding expenses could increase further. Delays might postpone conversion of the backlog. Two clients accounted for 65% of revenue in the first quarter. Backlog relies on ability to deliver and provide service.
CoreWeave will release its second-quarter earnings on August 11, with a conference call scheduled for 5 p.m. EDT. Key metrics to watch include interest, capital expenditures, and adjusted operating profit.
Related articles: NASDAQ:CRWV



![Asia Stock Market Today 24/08/2026 [UPDATE: 08:08 SGT] [Chip Buybacks Brace Seoul as Oil Tests Asia’s Open]](https://ts2.tech/wp-content/uploads/2026/08/Asia-market-dashboard-2026-08-24-0808-480x384.jpg "Asia Stock Market Today 24/08/2026 [UPDATE: 08:08 SGT] [Chip Buybacks Brace Seoul as Oil Tests Asia’s Open]")