
NEW YORK, August 3, 2026, 14:08 EDT — Nasdaq is open for regular session trade.
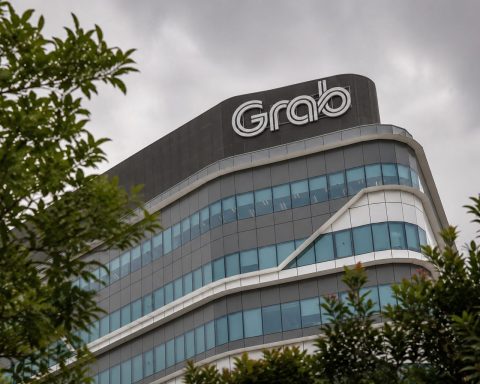
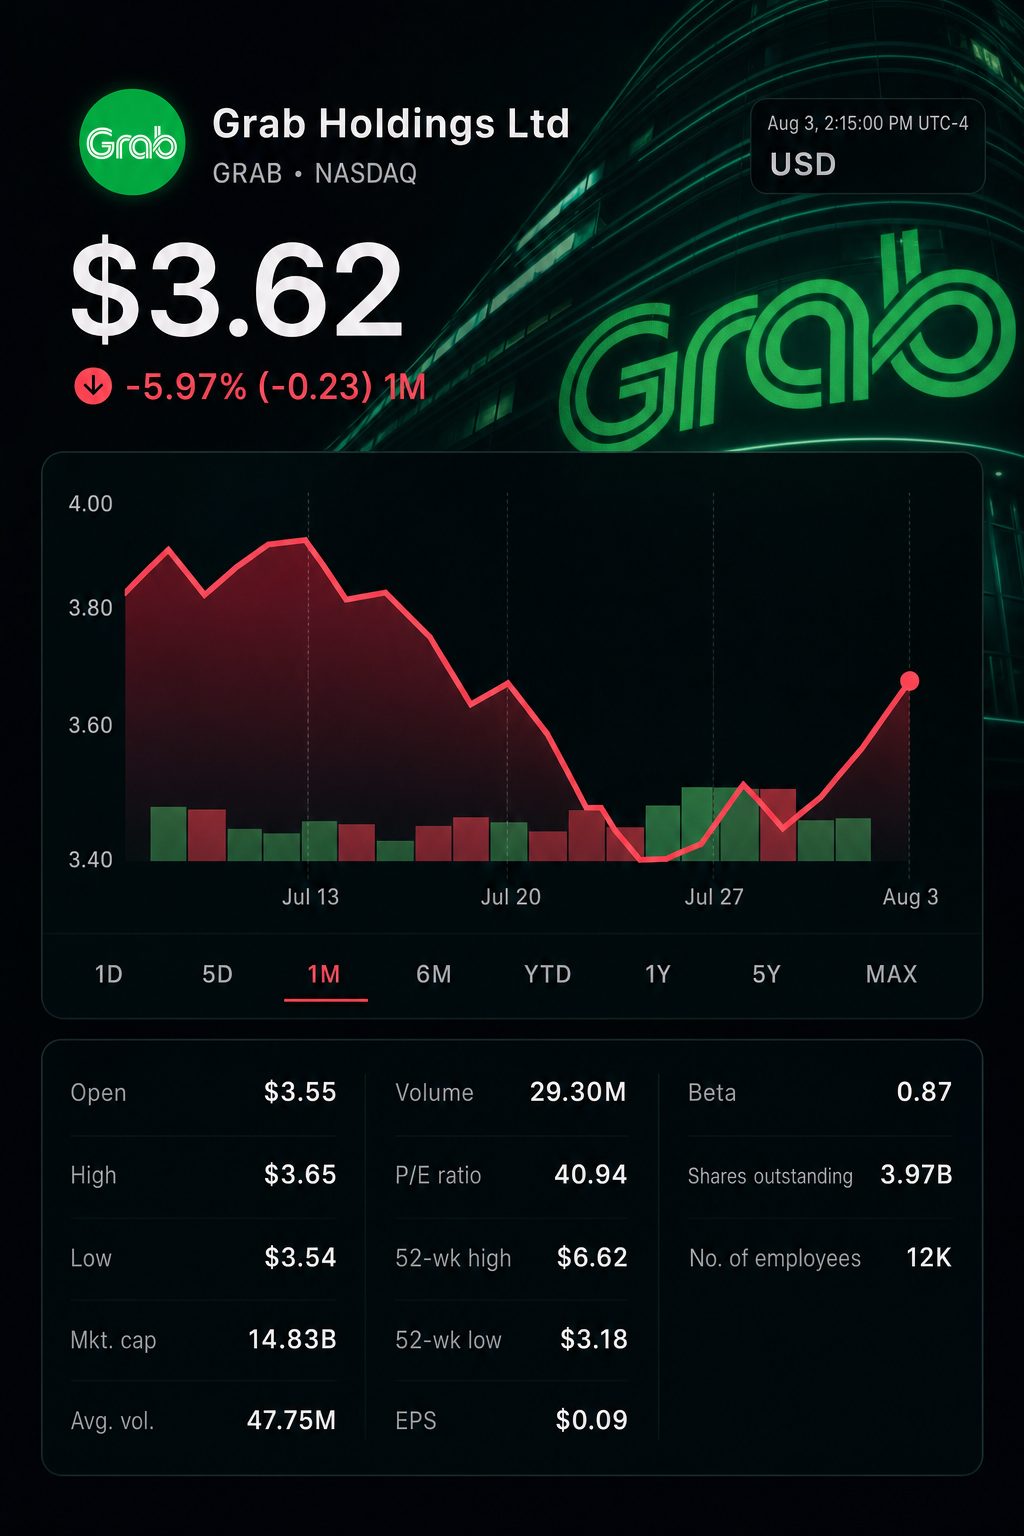
- Shares of Grab Holdings Limited NASDAQ:GRAB were up 3.1% to $3.61 at 1:53 p.m. ET.
- Early estimates project second-quarter revenue at $990.36 million.
- Company forecasts suggest adjusted EBITDA margin will rise for the rest of the year.
Grab gained ahead of its second-quarter results, scheduled for release after U.S. markets close. The rise mirrored positive momentum seen in other ride-hailing and delivery stocks.
Revenue figures will appear less straightforward than typical. Grab started fully consolidating Superbank in May and intends to update its group guidance.
This brings focus to operating leverage. Company data suggests an adjusted EBITDA margin of 17.7%-18.0% for the rest of the 2026 revenue base, up from 16.2% in the first quarter.
| Company | Price | Monday move | Market value |
|---|---|---|---|
| Grab Holdings Limited NASDAQ:GRAB | $3.61 | rose 3.14% | $14.27 billion |
| Sea Limited NYSE:SE | $109.77 | advanced 2.84% | $63.05 billion |
| Uber Technologies Inc. NYSE:UBER | $71.11 | added 1.07% | $147.28 billion |
| DoorDash Inc. NASDAQ:DASH | $200.75 | gained 2.34% | $88.81 billion |
Prices reflect delayed data as of approximately 1:53 p.m. ET.
Each of the four stocks gained. Grab outperformed Uber and DoorDash, just slightly ahead of Sea. This uptick was not fully driven by company-specific factors.
| Revenue bridge | Amount |
|---|---|
| Q2 2025 reported revenue | $819.00 million |
| Q2 2026 initial average estimate | $990.36 million |
| Projected Q2 year-on-year growth | 20.9% |
| Estimated H1 2026 revenue | $1.945 billion |
| 2026 full-year outlook | $4.04-$4.10 billion |
| Revenue needed in H2 | $2.095-$2.155 billion |
| H2 average revenue needed per quarter | $1.047-$1.077 billion |
| H2 year-on-year growth needed vs. 2025 | 17.7%-21.1% |
Figures are based on Grab’s disclosed data, management forecasts, and prevailing consensus. Revenue for H2 2025 stood at $1.779 billion.
The initial Q2 estimate suggests growth of 20.9%. This keeps Grab’s full-year revenue goal within mathematical reach.
Based on the guidance midpoint, average quarterly revenue in H2 should reach approximately $1.06 billion. This figure stands about 7.3% higher than the preliminary Q2 projection. The top-line target appears achievable.
Chief Financial Officer Peter Oey stated in May that Grab was “firmly on track.” Adjusted EBITDA for the first quarter climbed 46% to $154 million. Revenue was up 24% at $955 million. Grab
| Measure | Q1 2026 reported | FY 2026 outlook | Q2-Q4 average needed | Q1 growth required |
|---|---|---|---|---|
| Revenue | $955 million | $4.04-$4.10 billion | $1.028-$1.048 billion | 7.7%-9.8% |
| Adjusted EBITDA | $154 million | $700-$720 million | $182.0-$188.7 million | 18.2%-22.5% |
| Adjusted EBITDA margin | 16.2% | — | 17.7%-18.0% on subsequent revenue | 1.6-1.9 points |
Grab’s initial first-quarter guidance forms the basis for the required average calculations.
The profit threshold rises. To meet targets, the next three quarters each need adjusted EBITDA averaging between $182 million and $189 million.
A slight revenue outperformance might have little impact. Investors are seeking stronger profits or a defined plan for improved margins in the second half.
Superbank increases scale, but also introduces accounting noise. Customer numbers exceeded six million, with daily transactions above one million. The bank posted its initial full-year profit in 2025. Assets climbed 72% to $1.4 billion by April.
| Q1 operating measure | 2026 | 2025 | Change |
|---|---|---|---|
| On-demand GMV | $6.131 billion | $4.932 billion | +24% |
| Partner incentives | $305 million | $215 million | +42% |
| Consumer incentives | $345 million | $286 million | +21% |
| Total incentives | $650 million | $501 million | +29.7% |
| Adjusted EBITDA | $154 million | $106 million | +46% |
| Gross loan portfolio | $1.438 billion | $625 million | +130% |
| Operating cash flow | -$59 million | $73 million | Not applicable |
Total incentives comprise both partner and consumer incentives.
The operational figures present a mixed picture. While adjusted EBITDA rose at a faster pace than revenue, incentives increased faster than on-demand GMV.
Partner incentives increased by 42%, in part due to fuel assistance measures. The loan portfolio expanded by 130%, and loan growth led to negative operating cash flow.
Grab is trading at $3.61, marking a 13.5% rise from its 52-week low, but still trails 45.5% below its 52-week peak of $6.62.
Risks: Margins may face pressure from fuel-based incentives, credit defaults and competition within the region. Consolidation among superbanks further limits quarter-on-quarter comparability.
Results will be released following 4 p.m. ET. The management call is set for 8 p.m. ET. Investors will focus on adjusted EBITDA, on-demand GMV, and updated guidance.
Related articles: NASDAQ:GRAB