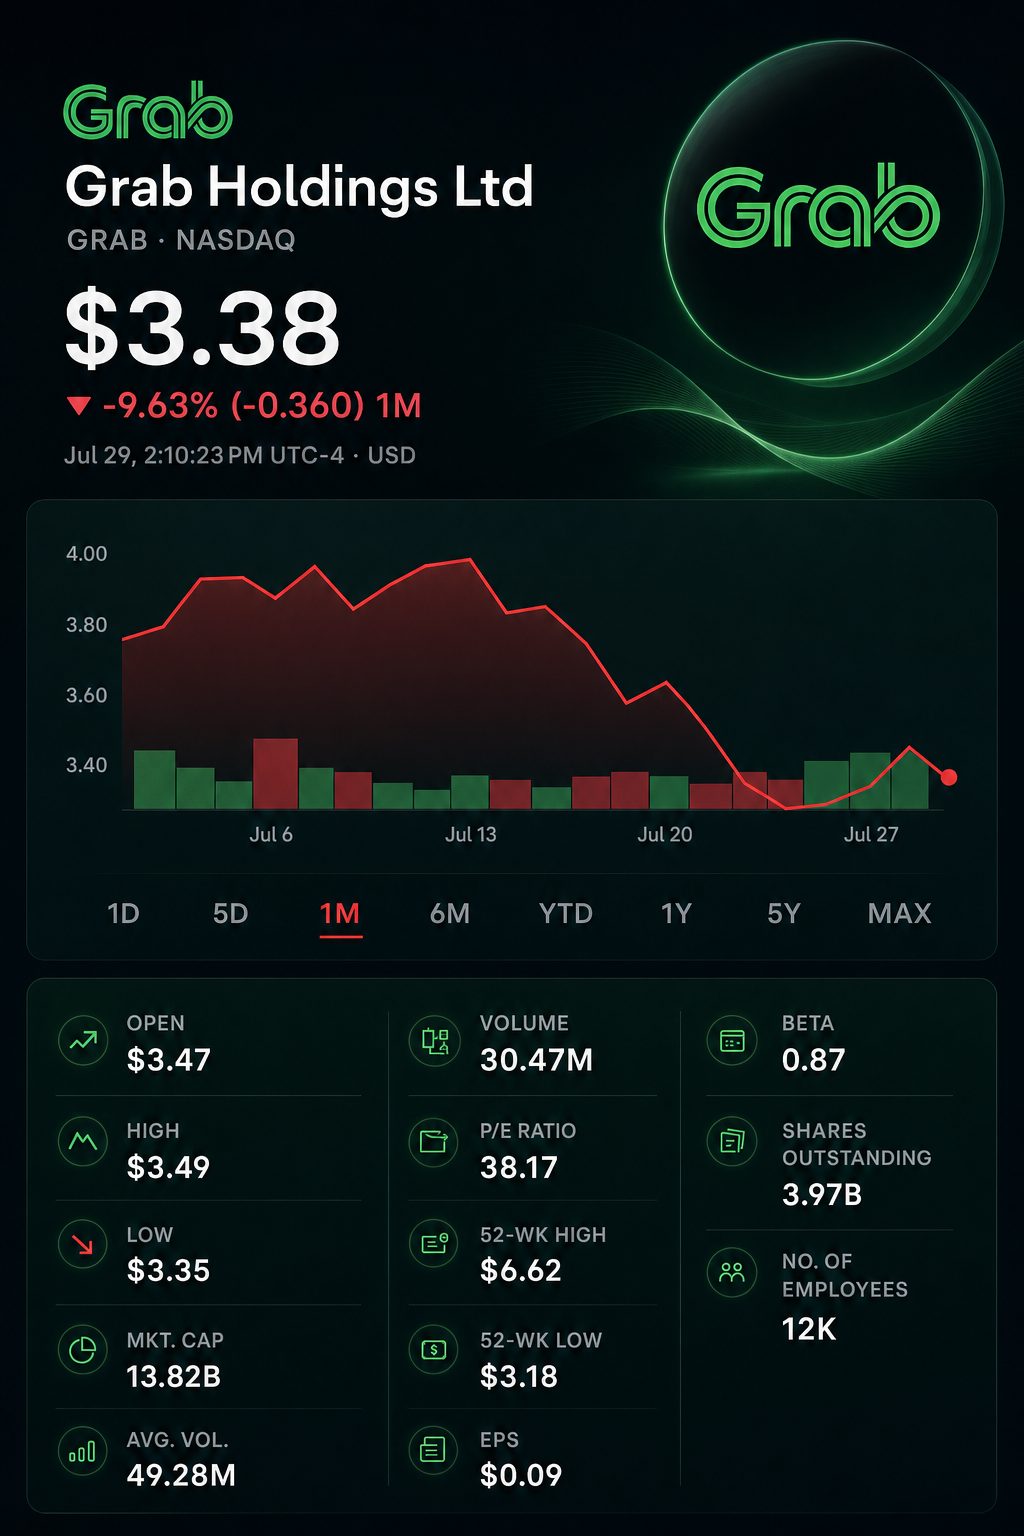
The stock was last seen around $3.38, about 49% off its 52-week peak.
The current consensus for preliminary Q2 revenue stands at $1.0 billion, representing a 4.7% increase compared to Q1.
Following Superbank’s consolidation, management will revise 2026 guidance on August 3.
Shares of Grab Holdings Limited NASDAQ:GRAB hovered around $3.38 during early U.S. trading on Wednesday, slipping roughly 2%. The stock underperformed the S&P 500 and stayed near its lowest point over the past 52 weeks.
The next trigger is set for Monday. Grab will disclose its unaudited second-quarter earnings following the U.S. market close on August 3.
Analysts’ initial projections show revenue reaching $1.0 billion, representing a 22.3% rise year-over-year. This figure would mark an increase of just 4.7% from the first-quarter revenue of $955 million.
That discrepancy means profit conversion offers a clearer assessment. Grab’s current forecast is for revenue between $4.04 billion and $4.10 billion, and adjusted EBITDA ranging from $700 million to $720 million. The table reflects the midpoint for each range.
Test
Latest base
Existing target or preliminary estimate
Implied hurdle
Q2 revenue
Q1 actual: $955 million
Q2 consensus: $1.0 billion
Quarterly rise of 4.7%
Full-year revenue
Guidance midpoint: $4.07 billion
Q1 actual and Q2 estimate: $1.955 billion
Average for Q3-Q4 roughly $1.06 billion
Adjusted EBITDA
Q1 actual: $154 million
Guidance midpoint: $710 million
Average for Q2 through Q4 about $185 million
The Q2 revenue number provided is based on an early consensus from external sources rather than official company projections. With this figure, achieving the current annual midpoint would need average revenue of roughly $1.06 billion across the last two quarters. This represents an increase of just 5.8% over the Q2 consensus estimate.
The bar for profit is higher. Following $154 million in Q1, the company needs to post an average quarterly adjusted EBITDA of approximately $185 million for the rest of the year. This is nearly 20% higher than the first quarter.
In the first quarter, revenue increased by 24%, with adjusted EBITDA climbing 46%. The adjusted EBITDA margin expanded to 16.2%, up from 13.7%.
Expansion came at a cost. On-demand incentives rose to 10.5% of gross merchandise value, an increase of 0.46 percentage point. Partner incentives increased by 42% as regional fuel expenses grew.
The accounting structure shifts in Q2, as Grab’s financial-services segment has included PT Super Bank Indonesia Tbk IDX:SUPA since May. Grab stated that revised group guidance will be released with its August results.
Superbank counted over 6 million customers and handled upwards of 1 million transactions each day. Assets increased by 72% from a year earlier in April, while net interest income climbed 84%.
Grab’s President and Chief Operating Officer Alex Hungate pointed to “a scalable, lower-cost distribution channel” as well as “enhanced credit underwriting powered by Grab’s transaction data.” The company must now demonstrate if these assertions hold up under the scrutiny of public earnings. Grab Holdings Investor Relations
Financial services outpaced the overall group in growth. First quarter revenue climbed 43% to $107 million. The gross loan portfolio surged 130% to reach $1.44 billion, though segment adjusted EBITDA stayed negative at $17 million.
A headline revenue beat could be less significant than normal. Investors will want data that distinguishes core platform growth from revenue contributed by Superbank. Levels of credit costs, bank capital, and incentive expenses will also be important.
Risks continue to be centered in Indonesia. Grab and GoTo IDX:GOTO lowered commissions for two-wheel drivers to 8% from 20% starting July 1. This adjustment may pressure take rates or call for more support for drivers. Fast-paced loan growth combined with currency volatility increases exposure.
Grab shares have fallen around 32% in 2026 and are trading nearly 49% under their 52-week peak. The report on Monday needs to clarify what portion of recent growth is organic and how much translates to profit.
What is keeping Grab shares close to their lows even with strong growth?
GRAB was last at $3.37, down 2.3%, at 17:45 UTC on July 29, 2026, giving the company a market capitalization of $13.3 billion. The shares were about 6% above the 52-week low of $3.18. First-quarter revenue climbed 24%, and adjusted EBITDA was up 46%. The results highlight how investors are still concentrating on operational execution along with credit and deal-related risks.
What are the expectations for Grab in the August 3 earnings release?
Grab is set to announce its second-quarter results after U.S. markets close on August 3, 2026. Analysts’ forecasts generally fall between $990 million and $1.01 billion in revenue, suggesting year-on-year growth in the 21% to 23% range. EPS projections span one to two cents. Investors are focused on fresh guidance following the Superbank consolidation.
Is Grab on track to meet its 2026 targets?
Management reaffirmed its revenue outlook at $4.04 billion to $4.10 billion, and maintained adjusted EBITDA guidance of $700 million to $720 million. For the first quarter, revenue reached $955 million with adjusted EBITDA at $154 million. To meet the midpoint of guidance, $3.12 billion in revenue is needed over the remaining three quarters, along with $556 million in adjusted EBITDA. This requires an average of $1.04 billion in revenue and $185 million in adjusted EBITDA each quarter. Hitting these marks is achievable, though it will demand unusually steady execution.
How sustainable is Grab’s stated profitability?
Q1 operating profit stood at $22 million, compared with a $21 million loss. Net profit totaled $120 million, a jump from $10 million. The quarter featured a $95 million net fair-value gain. Operating cash flow was negative $59 million. Adjusted free cash flow came in at positive $98 million. Share-based compensation amounted to $78 million. Although profitability saw a strong rise, cash conversion was still inconsistent.
Is growth in Mobility and Deliveries occurring without a negative impact on margins?
In Q1, Deliveries GMV climbed 25% to $3.91 billion. Delivery revenue was up 23%, while segment EBITDA rose 40%. The segment posted an EBITDA margin of 2.3% of GMV. Mobility GMV increased 23% to $2.22 billion, with Mobility EBITDA up 24% and an EBITDA margin at 8.9% of GMV. Company-wide incentives totaled $650 million, or 10.5% of GMV—the incentive rate moved up by 46 basis points, maintaining pressure from subsidies.
Could Financial Services emerge as Grab’s largest risk?
Financial Services posted a 43% increase in revenue to $107 million for Q1. The gross loan portfolio surged 130% to $1.44 billion. Loan disbursements advanced 67% to reach $1.1 billion. Segment adjusted EBITDA stood at negative $17 million. Net impairment losses climbed 45%, rising from $33 million to $48 million. Customer deposits totaled $1.63 billion. Growth remains strong, although underwriting persists as the main risk.
What impact will Superbank consolidation have on Grab’s figures?
Grab started integrating Superbank into its operations in May after acquiring more than a 50% stake. Superbank counted over six million customers, recording one million daily transactions. Assets climbed 72% to nearly $1.4 billion as of April. Net interest income jumped 84% from a year earlier. The bank achieved its first annual profit in 2025. While operational scale is growing, Grab now directly carries regulated credit risk. The company intends to issue updated group guidance with its Q2 results.
Do the Stash and foodpanda Taiwan agreements generate sufficient value?
Grab completed its controlling acquisition of Stash on July 1, 2026. Stash serves over one million subscribers and manages $5 billion in assets. The company has already achieved positive adjusted EBITDA as well as positive cash flow. Grab forecasts EBITDA exceeding $60 million in 2028. The 50.1% stake valued the business at $425 million; subsequent payments are subject to adjustment. Grab's pending Taiwan transaction is valued at $600 million and included a gross merchandise value (GMV) of $1.8 billion. The company is aiming for at least $60 million in 2028 EBITDA for that business, but integration outcomes are not yet clear.
Can future buybacks counteract shareholder dilution?
Grab approved $500 million for share repurchases in May, executing a $250 million ASR and a $150 million contingent forward contract. The accelerated repurchase initially delivered 54.9 million shares. The maximum possible $400 million represents about 3% of its market capitalization, while Q1 compensation totaled $78 million. Grab also issued $1.5 billion in zero-coupon convertible notes due 2030. Priced at $6.55 per note, the convertibles initially cover about 229 million shares. While cash settlement may help reduce dilution, not all new issuances can be offset by buybacks.
What is a practical outlook for GRAB stock over the next 12 months?
With shares at $3.37, my primary 12-month target range is $4.50 to $5.50, representing a potential rise of 34% to 63%. Bullish and bearish scenarios are set at $6.50–$7.00 and $2.75–$3.25, respectively. Sell-side analyst consensus is around $5.88 to $6.01, subject to source differences. Based on March net cash, enterprise value stands close to $8.3 billion, or about 11.7 times the midpoint of 2026 adjusted EBITDA. Ongoing acquisition activity and uncertain Superbank integration increase unpredictability across all projections.
Khadija Saeed is a financial markets reporter at TS2.tech. Her coverage ranges from stocks and technology to emerging industries and developments across global markets. She studied economics and finance at the London School of Economics and worked in market research before becoming a financial journalist. Follow Khadija Saeed on Google News.
Surprising starts and permits data can impact homebuilders, mortgage-sensitive stocks, Treasury yields, and the dollar if results deviate significantly from consensus estimates.
#02
Home Depot Q2
The results and outlook provide key insights into housing turnover, renovation demand, professional customer activity, and U.S. discretionary spending.
#03
09:15 ET industrial production
A robust or disappointing factory or utilities report can shift expectations for economic growth, cyclical stocks, bond yields, and the Federal Reserve’s policy direction.