
NEW YORK, August 17, 2026, 3:47 p.m. EDT — U.S. cash markets remained open.
- Grab’s stock was last down 0.4% at $3.61, with trading volume at approximately 28.3 million shares.
- The $750 million in new authorization represents about 5.3% of Grab’s market capitalization of $14.25 billion.
- Incentives for the quarter totaled $706 million, coming close to the recently approved repurchase authorization.
Shares of Grab Holdings Limited NASDAQ:GRAB were down 0.4% at approximately $3.61 on Monday. By 3:36 p.m. EDT, around 28.3 million shares had changed hands, placing the stock among the most actively traded on Yahoo Finance.
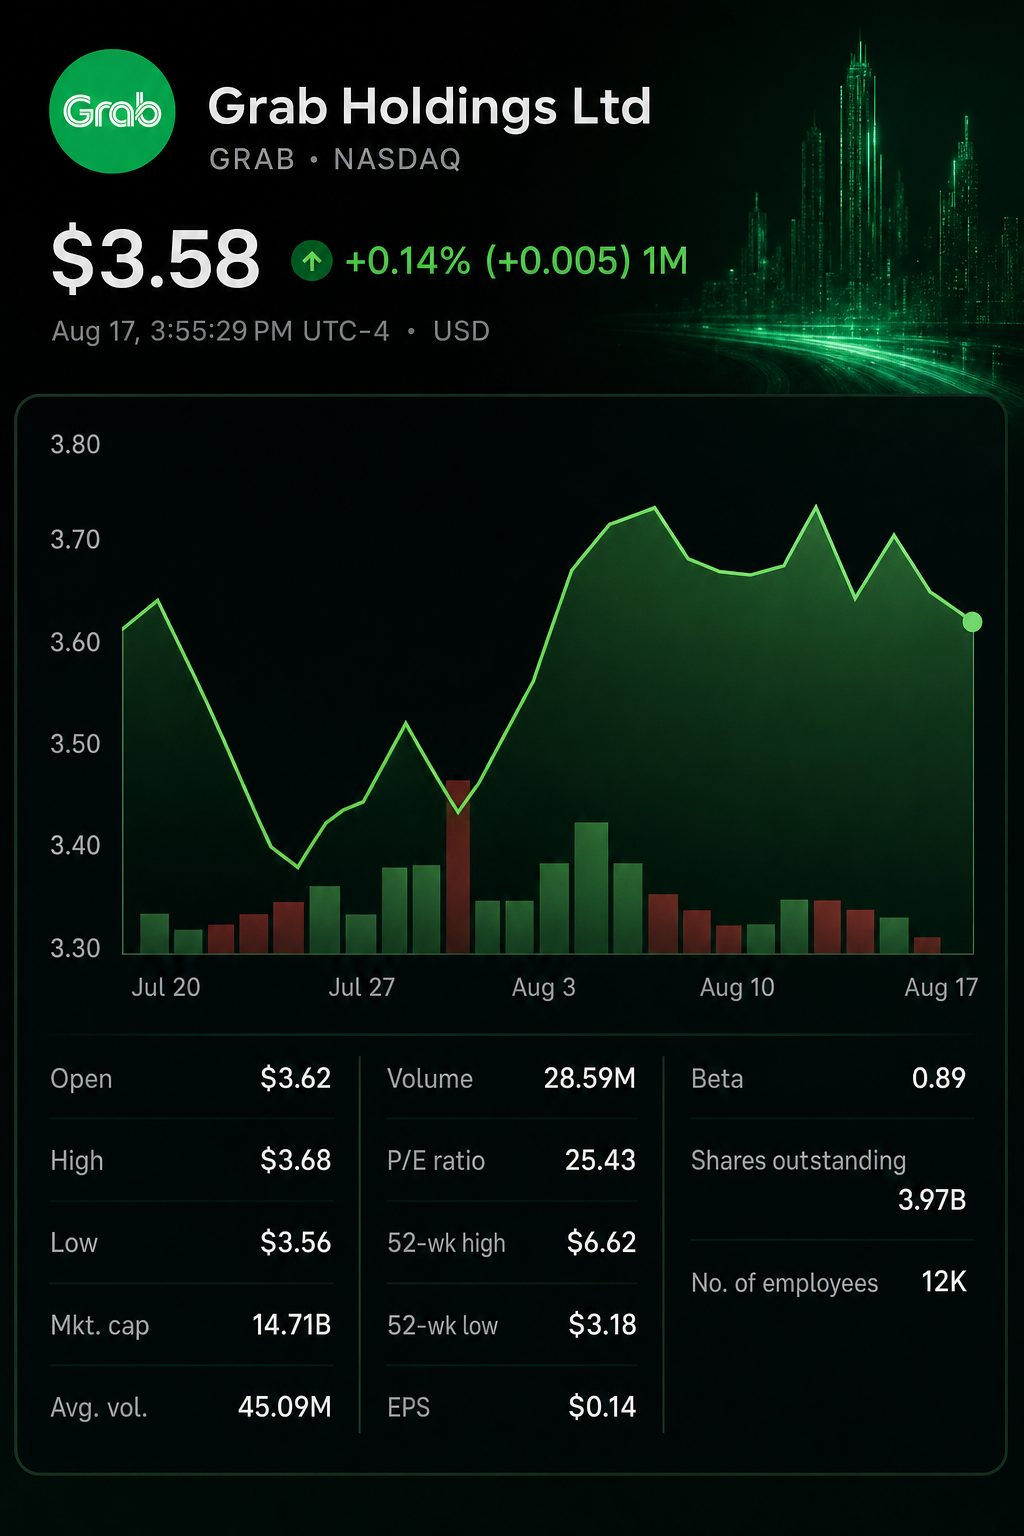
Grab’s recently approved $750 million share buyback stands out for its size relative to the company’s equity value. Based on Monday’s closing price, the programme would enable the repurchase of roughly 208 million shares, equal to about 5.3% of its market capitalization.
| Monday trading snapshot | Value | Investor comparison |
|---|---|---|
| Share price | $3.61 | Lower by roughly 0.4% |
| Intraday range | $3.56-$3.68 | Spread at 3.4% |
| Volume by 3:36 p.m. EDT | 28.3 million | One of Yahoo’s most traded shares |
| Market capitalization | $14.25 billion | Repurchase is 5.3% |
The board gave the green light to the program following $351 million in completed repurchases by July. The total approved since 2024 has now reached $1.75 billion. Grab is not obligated to purchase a specified quantity under the program.
| Capital-allocation measure | Amount | New buyback relative to measure |
|---|---|---|
| New buyback approval | $750 million | 100% |
| Net cash on hand | $5.4 billion | 13.9% |
| Past year’s adjusted free cash flow | $450 million | 1.67 times |
| Market capitalization at Monday close | $14.25 billion | 5.3% |
| Total buyback authorization from 2024 | $1.75 billion | 12.3% of market value |
The plan may be backed by liquidity. As of June 30, Grab held $5.4 billion in net cash liquidity. However, the authorization represents 1.67 times the adjusted free cash flow over the past year, placing emphasis on timing and execution.
Revenue for the second quarter increased by 22% to $997 million. Adjusted EBITDA climbed 54% to $168 million, with the margin rising to 16.9% compared with 13.3%. The firm updated its 2026 guidance, now expecting revenue between $4.10-$4.15 billion and adjusted EBITDA between $720-$740 million.
| Second-quarter measure | Q2 2026 | Year-on-year comparison |
|---|---|---|
| Revenue | $997 million | Rose 22% |
| On-Demand GMV | $6.5 billion | Increased 21% |
| Adjusted EBITDA | $168 million | Surged 54% |
| Adjusted EBITDA margin | 16.9% | Improved from 13.3% |
| Profit for the period | $235 million | Jumped from $20 million |
| Monthly transacting users | 54 million | Climbed 17% |
The headline profit inflates underlying earnings. Grab recorded a single $307 million gain from its consolidation of Superbank. This was partially balanced by a $183 million fair-value loss related to financial assets and liabilities.
Growth was widespread, but the quality differed. Financial Services posted the fastest revenue increase, driven by Superbank’s consolidation in June. Deliveries accounted for the largest revenue share and saw improved unit margins.
| Segment | Q2 revenue | Revenue growth | Profitability comparison |
|---|---|---|---|
| Deliveries | $531 million | 21% | Adjusted EBITDA/GMV increased to 2.3% from 1.8% |
| Mobility | $331 million | 12% | Adjusted EBITDA/GMV slipped to 8.6% |
| Financial Services | $134 million | 59% | Adjusted EBITDA loss reduced to $15 million from $26 million |
Grab allocated $706 million to consumer and partner incentives for the quarter. On-Demand incentives accounted for 10.9% of GMV, increasing by 72 basis points. Executives stated that the investment maintained affordable service options and stable driver pay as fuel prices rose.
Peter Oey, Chief Financial Officer, told Reuters that Grab’s shipping speed is now triple what it was a year ago. Oey added that AI-powered tools have eliminated close to 40,000 hours of sales inefficiencies.
| Analyst recommendation measure | Current reading | Comparison |
|---|---|---|
| Consensus rating | Moderate Buy | 9 positive, 2 hold, 0 sell |
| Strong Buy ratings | 1 | 9% out of 11 evaluations |
| Buy ratings | 8 | Accounts for 73% of the 11 reviews |
| Hold ratings | 2 | Represents 18% of 11 assessments |
| Average price target | $6.01 | Around 66% higher than $3.61 |
| Target range | $5.00-$7.00 | Ranges from 39% to 94% above $3.61 |
Wall Street sentiment stays positive. MarketBeat shows that out of 11 analysts, eight rate the stock a Buy, one gives a Strong Buy, and two suggest Hold. The average price target stands at $6.01, indicating an estimated upside of about 66%. However, analyst targets are forecasts and not assurances.
The muted reaction in the stock shifts attention to buyback execution as the immediate focus. Completing the full authorization would be significant, while a gradual pace would mean investors depend largely on margin improvement and internal growth.
Risks: Incentive expenses may remain high should fuel prices or rivalry intensify. The Financial Services segment introduces credit risk, and both acquisitions and fair-value accounting can cause fluctuations in reported earnings.
Related articles: NASDAQ:GRAB