
NEW YORK, August 23, 2026, 13:06 EDT —
- Global markets came under pressure from elevated long Treasury yields, prompting an increase in search interest for “financial crisis.”
- On August 20, high-yield spreads stood at 2.75%, just eight basis points higher than their level on August 14.
- The VIX ended Friday at 15.13. JPMorgan dropped 3.1% during the week.
- Inflation figures and the Jackson Hole gathering will gauge if worry turns into wider risk aversion.
Increased searches related to a financial crisis coincided with market pressure rather than widespread panic. The S&P 500 fell 1.4% over the past week as long-term Treasury yields advanced. However, corporate credit spreads and equity volatility remained stable.
The gap provides a key indicator for investors. At present, most stress is concentrated in government bonds, oil, and high-priced equities. It has yet to make a clear move into corporate funding markets.
The market recovered in part on Friday. The S&P 500 was up 0.4% to 7,674.37, and the Dow climbed 1.0%, but both indices ended the week down. Over five sessions, the Nasdaq declined 2.1%.
| Stress gauge | Latest verified reading | Change or context | Investor read |
|---|---|---|---|
| VIX | 15.13, Aug. 21 | Dropped 5.5% on Friday | Investors vigilant but not alarmed |
| US high-yield OAS | 2.75%, Aug. 20 | 2.67% as of Aug. 14 | Spread widened by eight basis points |
| US 10-year Treasury | Roughly 4.74%, Aug. 21 close | Hovers close to multi-year peaks | Main source of market strain |
| Brent crude | Close to $95, Aug. 21 | Gained on Iran tensions | Presents inflationary threat |
The VIX, which gauges anticipated 30-day volatility in the S&P 500 based on options pricing, closed Friday at 15.13, falling 5.5% and remaining well under its 52-week peak of 35.30. This level does not indicate erratic hedging activity.
Credit markets reflected the trend. On August 20, the ICE BofA US High Yield option-adjusted spread stood at 2.75%. This spread measures the additional yield required by sub-investment-grade issuers over Treasuries. Compared to August 14, the spread increased by eight basis points, marking a moderate adjustment.
Government bonds experienced more volatility. The 10-year Treasury yield closed around 4.74% on Friday. Brent crude neared $95 as geopolitical risks drove energy prices higher. Elevated oil prices and increased borrowing expenses could put pressure on profits.
| Market proxy | Aug. 21 close | Weekly move | What it tracks |
|---|---|---|---|
| S&P 500 | 7,674.37 | -1.4% | Leading US firms |
| Nasdaq Composite | 26,180.45 | -2.1% | Technology and growth stocks |
| JPMorgan Chase NYSE:JPM | $351.58 | -3.1% | Key large bank |
| SPDR S&P Regional Banking ETF (NYSEARCA:KRE) | $74.55 | -4.3% | Regional lenders |
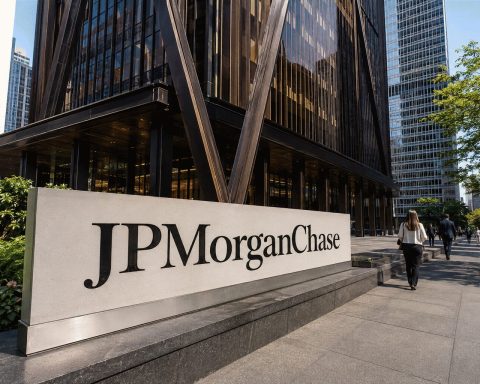
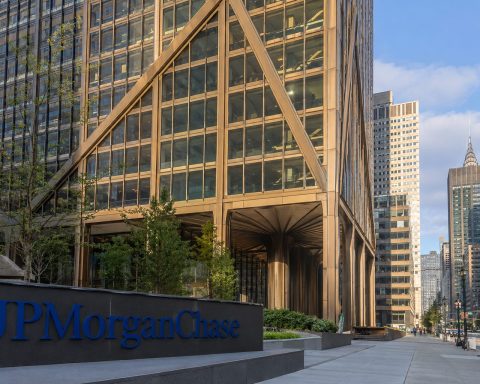
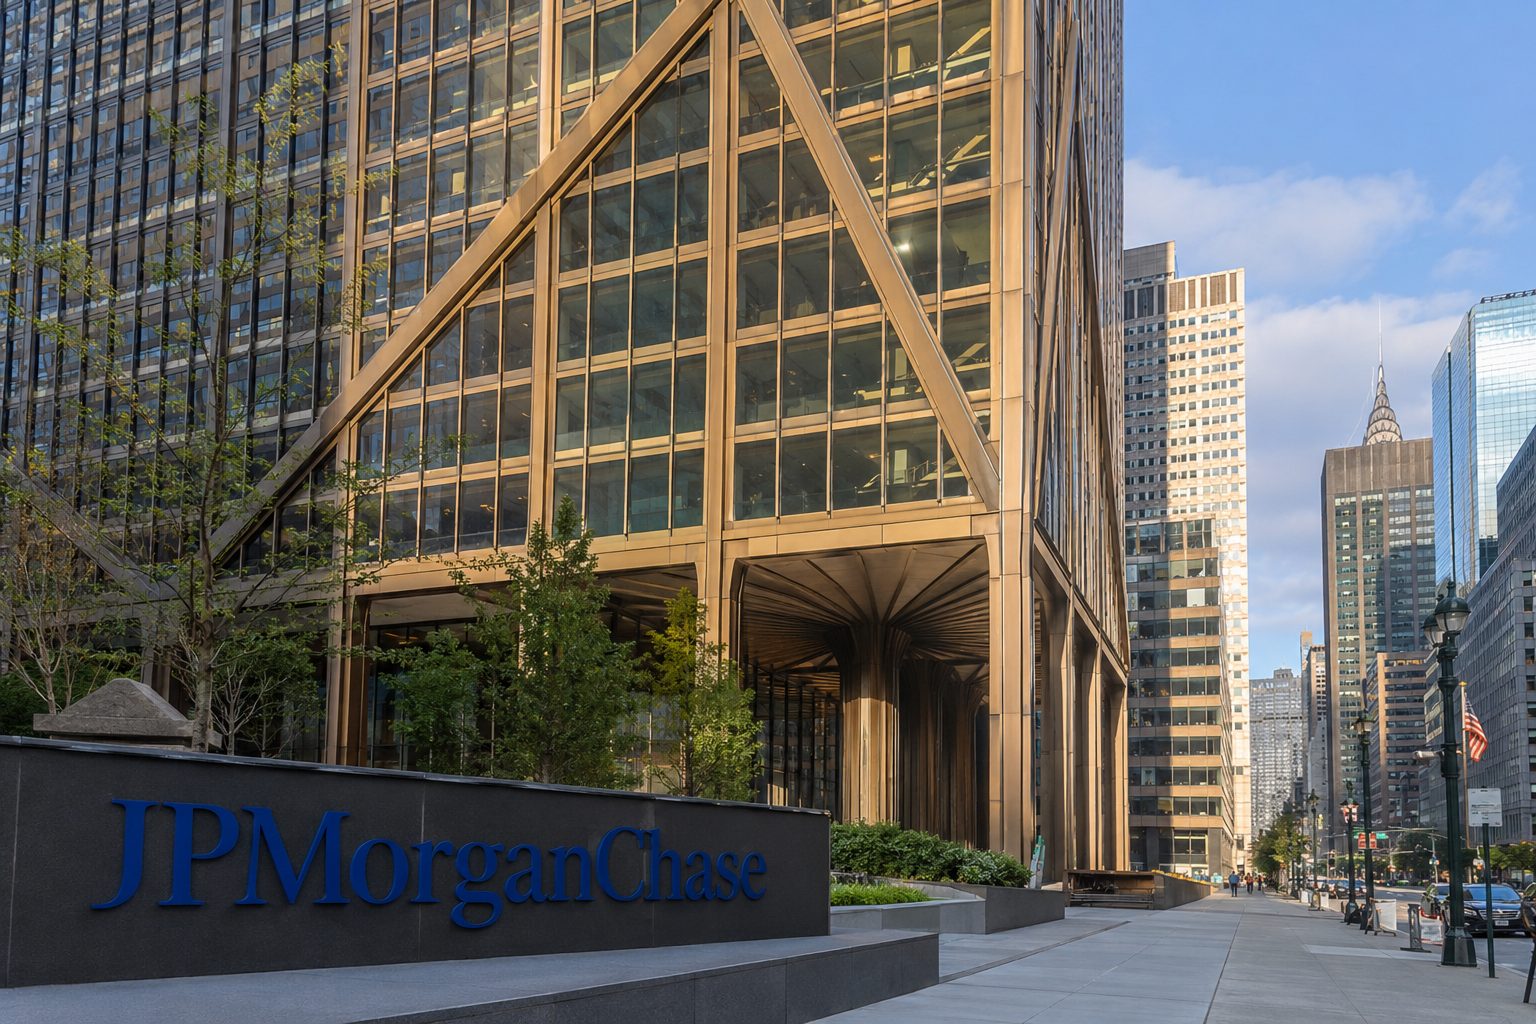
JPMorgan Chase NYSE:JPM finished Friday at $351.58, holding steady during the session but declining 3.1% since August 14. Regional lenders saw steeper losses: KRE slid 4.3% in the same timeframe.
The bank starts this phase with strong buffers. JPMorgan posted a 14.1% standardized common-equity Tier 1 ratio for June and carried $1.5 trillion in cash and marketable securities. Credit costs for the second quarter reached $2.5 billion.
| JPMorgan metric | Q2 2026 | Comparison | Stress relevance |
|---|---|---|---|
| Reported net income | $21.2 billion | $15.0 billion in the same period last year | Reflects large one-off gains |
| Net income excluding significant items | $16.9 billion | Return on tangible common equity 23% | Shows underlying earnings |
| Standardized CET1 ratio | 14.1% | $303 billion in CET1 capital | Capital buffer for absorbing losses |
| Credit costs | $2.5 billion | 12% lower year over year | No general credit spike seen |
Chief Executive Jamie Dimon said “several risks are shifting below the surface like tectonic plates.” He pointed to ongoing conflicts, persistent inflation, fiscal shortfalls and elevated asset prices. The company’s balance sheet is structured for a range of scenarios. JPMorgan SEC filing
| Analyst / firm | Recommendation | Price target | Date |
|---|---|---|---|
| Mike Mayo / Wells Fargo | Buy | $390 | Aug. 14, 2026 |
| Jason Goldberg / Barclays | Buy | $420 | Aug. 10, 2026 |
| David Chiaverini / Jefferies | Hold | $370 | Aug. 3, 2026 |
| Erika Najarian / UBS | Buy | $400 | Aug. 3, 2026 |
The next challenge looms. Wednesday brings US inflation figures, durable-goods numbers, and updated GDP data. Federal Reserve policymakers meet in Jackson Hole later this week. Nvidia NASDAQ:NVDA will post results Wednesday after the bell, putting the market’s key growth trade to the test.
Risks: Additional increases in oil prices and Treasury yields may cause credit spreads to widen further. If high-yield OAS climbs above 3.25% and the VIX goes over 25, this could signal a significant regime change. A decline in inflation or a reduction in geopolitical tensions could undo last week’s defensive shift.
At present, the financial-crisis search trend signals caution. Credit markets have not yet validated the warning.
Related articles: NYSE:JPM