
Best Buy Shares Drop 5.4% Despite Tariff Refund Boosting Profit Forecast, Nearly $1 Billion in Value Lost

Best Buy Shares Drop 5.4% Despite Tariff Refund Boosting Profit Forecast, Nearly $1 Billion in Value Lost

MINNEAPOLIS, August 27, 2026, 10:30 (EDT)

  • Shares of Best Buy dropped 5.4% to $82.73 during Thursday morning trade.
  • The drop wiped out an estimated $995 million in quoted equity value.
  • Comparable sales grew by 4.1% in the second quarter, with adjusted EPS up 15%.
  • A tariff refund of $34 million accounted for roughly 63% of the increase in the domestic gross-margin rate.

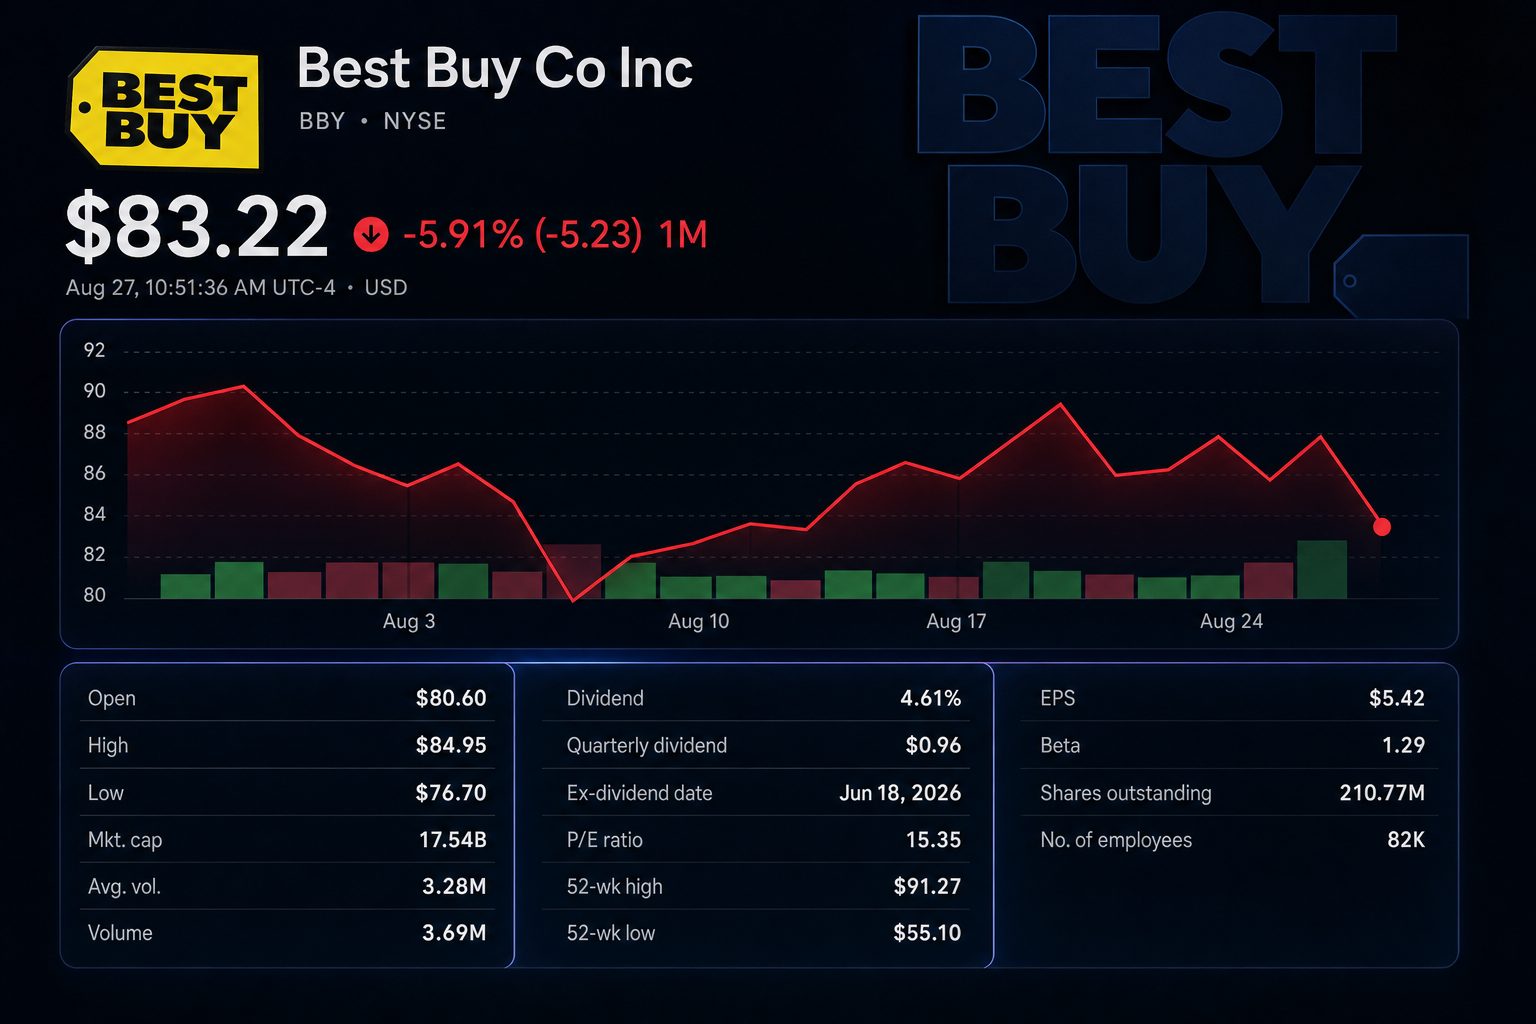
Best Buy Co. stock dropped 5.4% even after reporting quarterly results that topped estimates and raising its full-year forecast. Shares were last at $82.73 as of 10:29:49 a.m. EDT, with trading volume hitting 3.52 million shares NYSE:BBY market data.
Stock chart for NYSE:BBY

The drop reduced Best Buy’s market capitalization to roughly $17.47 billion, wiping out about $995 million since Wednesday’s close. The loss was greater than the $900 million boost in the midpoint of revenue guidance.

Best Buy posted second-quarter revenue of $9.78 billion, a 3.6% increase. Comparable sales advanced 4.1%. Adjusted diluted earnings per share climbed 15% to $1.47 Best Buy’s results.

The retailer increased its full-year revenue outlook to $42.3 billion to $42.8 billion, up from the earlier projection of $41.2 billion to $42.1 billion. Forecast for comparable sales was lifted to a range of 1.9% to 3.0%, compared to the previous guidance of negative 1% to positive 1%.

The company raised its adjusted EPS guidance to a range of $6.70-$6.90, up from $6.30-$6.60. The midpoint increased by 35 cents, or 5.4%. Thursday’s share price is approximately 12.2 times that updated midpoint.

MeasureCurrentPrior / year earlierChange
Q2 revenue$9.779B$9.438Bup 3.6%
Comparable salesup 4.1%up 1.6%increase of 250 bps
Adjusted operating margin4.3%3.9%gain of 40 bps
Adjusted diluted EPS$1.47$1.28up 14.8%
FY revenue midpoint$42.55B$41.65Brise of $0.90B
FY adjusted EPS midpoint$6.80$6.45increase of $0.35

The margin improvement came under examination. Domestic gross margin increased by 60 basis points to reach 24.0%. According to Best Buy, a $34 million tariff refund played a role in the rise.

Using 60 basis points on $9.07 billion in domestic revenue suggests an increase of $54 million. The refund thus accounted for about 63% of that margin gain. The drop in the stock’s value was 29 times greater than the refund.

Product economics continue to be uneven. Higher memory expenses drove average selling prices up by a mid-single-digit percentage, while unit sales declined by a high-single-digit percentage, incoming CEO Jason Bonfig said Reuters.

Growth was driven by computing and home theater. AI glasses and trading cards contributed as well. Traditional gaming and international comparable sales were down.

Departing CEO Corie Barry stated that shoppers continue to purchase high-priced items “when there is technology innovation.” Demand for appliances continues to be under pressure due to challenges in the housing market. Increased fuel prices could impact margins in the latter half.

The decline also highlights concerns over valuation. Best Buy shares had climbed roughly 30% in the year to Wednesday. According to a consensus from 25 analysts, the stock is rated Hold, with an average price target of $83.40 analyst consensus.

Risks: Declines in unit sales could accelerate if high food, fuel and housing expenses limit discretionary purchases. Product margins may face pressure due to memory inflation. The one-off refund is not expected to recur unless more claims are approved.

Third-quarter comparable sales are expected to rise 1%-3%, marking the next performance milestone. Investors are monitoring unit volumes and advertising revenue. These indicators will help determine if the improved outlook is backed by lasting demand.


Best Buy Co., Inc. · NYSE: BBY

A better quarter meets a tougher quality test

Market snapshot: August 27, 2026, 10:29:49 EDT
U.S. regular session
Share price
$82.73
−$4.71 · −5.39%
Market cap
$17.47B
~$995M erased
Q2 comparable sales
+4.1%
+250 bps year over year
FY27 EPS midpoint
$6.80
+$0.35 · +5.4%

Intraday reaction

Close $87.44Open $80.23High $91.35Low $77.00$82.73

The stock recovered from its session low but remained below Wednesday’s close after an initial volatile reaction.

Investor bridge

Equity-value loss
$995M

1.11× the $900M revenue-guidance midpoint increase.

29.3× the $34M tariff refund.

The response suggests investors discounted the durability of the stronger profit outlook.

Quarterly scorecard

MetricQ2 FY27Q2 FY26
Revenue$9.779B$9.438B
Comparable sales+4.1%+1.6%
Adjusted operating margin4.3%3.9%
Adjusted EPS$1.47$1.28
Domestic online sales+5.1%+5.1%
International comps−1.8%+7.6%

Guidance reset

FY27 measureNewPrior
Revenue$42.3B–$42.8B$41.2B–$42.1B
Comparable sales+1.9% to +3.0%−1.0% to +1.0%
Adjusted operating margin4.4%–4.5%4.3%–4.4%
Adjusted EPS$6.70–$6.90$6.30–$6.60
Capital expenditure~$750M~$750M

What drove the domestic margin lift

Implied rate lift
$54M
Tariff refund
$34M

A 60-basis-point increase applied to $9.07B of domestic revenue implies about $54M. The refund equals roughly 63% of that amount; this is a transparent approximation, not company guidance.

Valuation and consensus

Forward P/E on new midpoint
12.2×

Consensus: Hold
25 analysts
Average target: $83.40
Range: $62–$95

The live price sits about 0.8% below the average target.

Demand signals

Positive: computing, home theater, AI glasses, trading cards, Marketplace and Best Buy Ads.

Mixed: memory costs lifted average selling prices by a mid-single-digit rate while unit sales fell by a high-single-digit rate.

Weak: traditional gaming, appliances and international comparable sales.

Capital returns

Q2 dividends$203M
Q2 repurchases$36M
FY27 repurchase plan~$300M
Quarterly dividend$0.96/share
Implied annual yield~4.6%

Catalyst timeline

August 27 · Q2 FY27 resultsComparable sales +4.1%; adjusted EPS $1.47; annual guidance raised.
August 27 · Market reactionShares down 5.39% at 10:29:49 EDT after touching $77.00.
Fiscal Q3 · Next operating testComparable-sales guidance +1% to +3%; adjusted operating margin 4.1%–4.2%.
November 1 · CEO transitionJason Bonfig is scheduled to succeed Corie Barry.

Risk monitor

Watch unit volumes, memory inflation, appliance replacement demand and fuel costs. A weaker holiday build could expose how much of the annual raise came from the one-time refund rather than repeatable margin gains.

Sources: Best Buy Q2 FY27 release; Reuters; Google Finance; MarketScreener. Market figures observed August 27, 2026, 10:29:49 EDT. Calculations use rounded public inputs.

Roman Perkowski

Roman Perkowski is a senior markets reporter at TS2.tech. His coverage ranges from stocks and technology to economic developments across global markets. He graduated from the Cracow University of Economics and worked in investment research and corporate finance before becoming a financial journalist. Follow Roman Perkowski on Google News.

US Stock Market Today Updates

AI PORTFOLIO

Top Stock Picks

Today’s highest-ranked model selections.

#1 Strong Buy

NVIDIA

94/100
#2 Strong Buy

Meta Platforms

89/100
#3 Buy

Alphabet

87/100
#4 Buy

Amazon

84/100
#5 Selective Buy

Microsoft

82/100
View full portfolio
Editorial model selection. Not personalised advice.
Moderna Shares Drop 5.0%, Wiping Out $3.0 Billion as $2 Billion Convertible Notes Offering Challenges Cancer-Vaccine Surge
Previous Story

Moderna Shares Drop 5.0%, Wiping Out $3.0 Billion as $2 Billion Convertible Notes Offering Challenges Cancer-Vaccine Surge

ServiceNow Shares Surge 9%—$11.7 Billion Gain Linked to Salesforce AI Results Shifting Software Valuations
Next Story

ServiceNow Shares Surge 9%—$11.7 Billion Gain Linked to Salesforce AI Results Shifting Software Valuations