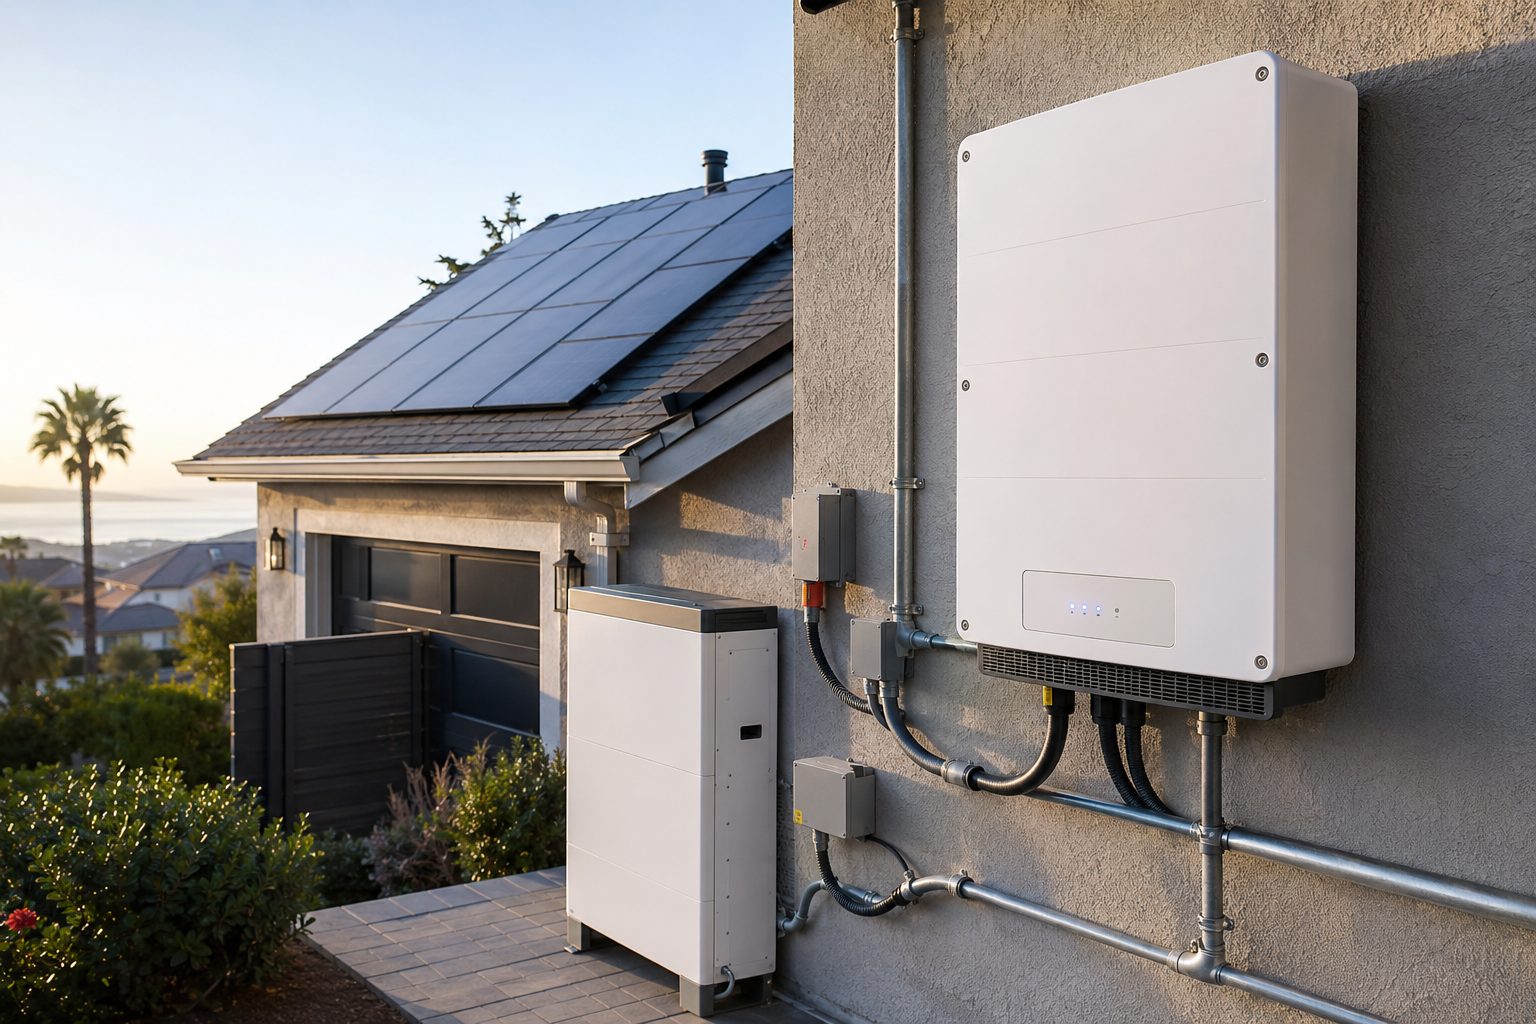

MILPITAS, California, August 27, 2026, 00:05 — SolarEdge Technologies stock jumped 10.7%, boosting its market capitalization by $197 million, following the company's wager on FCC-certified inverters.

Market snapshot: August 26, 2026, 20:15 EDT (August 27, 00:15 UTC). Fundamentals: quarter ended June 30, 2026.
SolarEdge added about $197 million in quoted value. Volume reached 6.53 million shares, or 2.1× the three-month average.
UBS upgraded SEDG to Buy and lifted its target to $42. The broker says FCC restrictions touch more than half the U.S. inverter market, creating a share, pricing and margin opening for U.S.-made products.
Q3 midpoint is 6.1% below Q2. Guided gross margin is 22%–26%.
| Measure | Old | New | Change |
|---|---|---|---|
| Price target | $36 | $42 | +16.7% |
| 2027 adj. EBITDA | $101M | $110M | +8.9% |
| 2028 adj. EBITDA | $173M | $190M | +9.8% |
The $197 million one-day value gain equals 1.79× UBS's 2027 estimate and 1.04× its 2028 estimate.
| Q2 revenue | $346.2M | +19.6% YoY |
| Q2 gross margin | 27.5% | +16.4 pts YoY |
| Battery shipments | 426 MWh | +104% YoY |
| Inverter shipments | 62,600 | -27.4% YoY |
| Free cash flow | $3.1M | Q2 2026 |
| Cash / inventory | $527M / $600M | June 30 |
| Company | Price | Day | Market cap |
|---|---|---|---|
| SolarEdge | $33.08 | +10.74% | $2.02B |
| Shoals | $7.31 | +6.10% | $1.24B |
| Enphase | $38.42 | +2.78% | $5.19B |
| First Solar | $205.93 | -0.48% | $22.19B |
Latest available quotes: August 26, 2026, 20:15 EDT.
$39.15 average target implies 18.4% upside. The range spans $24 to $100. UBS's $42 target sits 7.3% above the mean.
Consensus snapshot: August 26, 2026.
FCC implementation may be delayed, narrowed or exempt products. Financing costs can restrain residential installations. SolarEdge also must reduce inventory while defending price and converting U.S. capacity into profitable volume.
NASDAQ:SEDG · August 26, 2026, 11:06 EDT
| UBS | Buy · $42 |
| Consensus mix | 2 Buy / 10 Hold / 4 Sell |
| Average target | $35.13 · +9.2% |
| High / low | $65 / $6.90 |
| 52-week range | $28.21–$81.25 |
| Beta | 1.49 |
| Metric | Q2 2026 | Q2 2025 |
|---|---|---|
| Revenue | $346.2m | $289.4m |
| GAAP gross margin | 27.5% | 11.1% |
| GAAP operating loss | -$16.0m | -$115.5m |
| Adjusted operating income | $10.2m | -$48.3m |
| Free cash flow | $3.1m | -$9.1m |
| Q3 revenue guide | $310m–$340m |
| Midpoint vs Q2 | -6.1% |
| Adjusted GM guide | 22%–26% |
| Adjusted opex | $86m–$91m |
| Net cash/investments | $264.6m |
Risks: residential demand remains soft; pricing gains are an analyst forecast, not booked revenue; GAAP losses continue; policy and eligible supply can change.
Sources: SolarEdge Q2 2026 release; Google Finance; Yahoo Finance; UBS upgrade reported August 26, 2026. All market figures timestamped 11:06 EDT.
Today’s highest-ranked model selections.
The catalysts most likely to move markets.
Policy tone can move rates, USD, equities, gold and crypto simultaneously.
A weak final reading or elevated inflation expectations could pressure risk assets.
A surprise versus 58.0 may alter the near-term manufacturing-growth narrative.