
NEW YORK, August 5, 2026, 05:06 EDT
- Shares pointed to open at $12.15, rising 27.8% compared to Tuesday’s closing price.
- The App Growth Platform accounted for 58% of the rise in yearly revenue.
- Outlook signals reduced EBITDA for each quarter following the first-quarter performance.
Digital Turbine, Inc. NASDAQ:APPS jumped in premarket trading on Wednesday following stronger-than-expected quarterly results. U.S. premarket trade saw increased activity. The main session opens at 9:30 a.m. EDT.
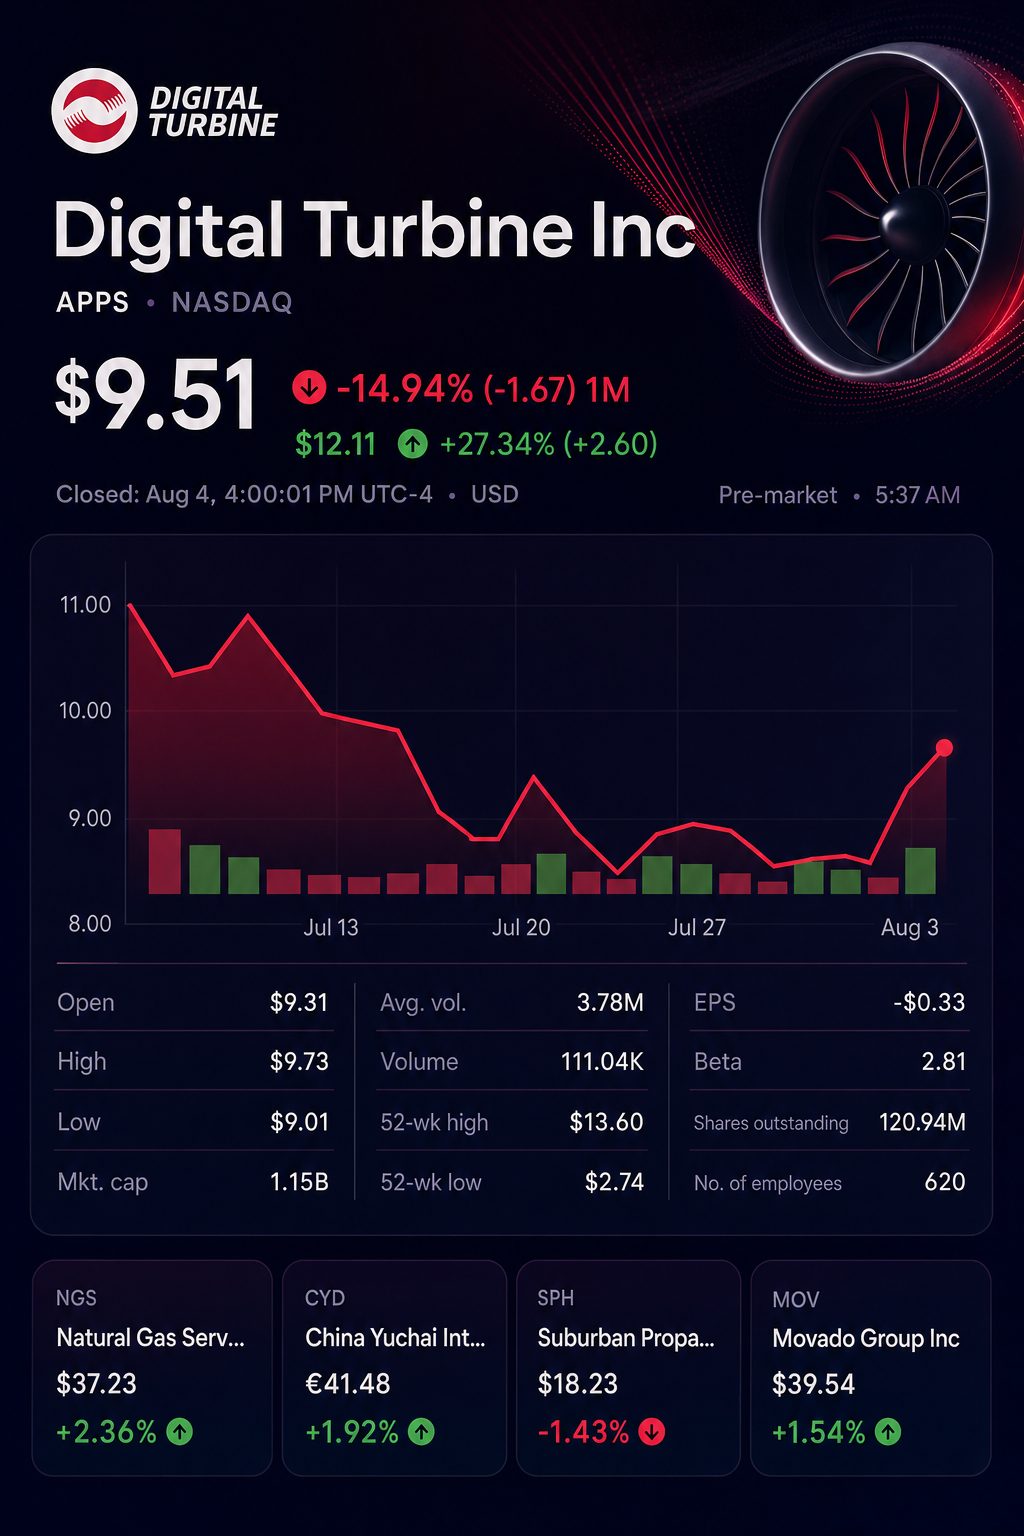
The initial quote was roughly 10% higher than the average target set by four analysts. Three of the individual targets had already fallen below the current stock price. Focus now turns to possible updates in estimates and targets.
The more pronounced impact stemmed from operating leverage. Revenue increased by 27%, and adjusted EBITDA climbed by 69%. Margin improved by 6.4 percentage points, reaching 25.6%.
| Metric | Q1 FY2027 | Q1 FY2026 | Change |
|---|---|---|---|
| Revenue | $166.0 mln | $130.9 mln | +27% |
| Adjusted EBITDA, non-GAAP | $42.5 mln | $25.1 mln | +69% |
| Adjusted EBITDA margin | 25.6% | 19.2% | +6.4 pts |
| Non-GAAP EPS | $0.19 | $0.06 | +$0.13 |
| GAAP operating income | $23.1 mln | $(4.7) mln | +$27.7 mln |
Adjusted EPS reached $0.19, surpassing the $0.09 forecast by Investing.com. Revenue totalled $166 million, beating the expected $145 million. The updated revenue outlook was above the $642 million consensus.
Chief Executive Bill Stone stated the outcomes were “not due to any single factor, but to many factors.” He pointed to international devices, demand for the brand, and AI-focused optimization. Investing.com
The primary driver of growth was the App Growth Platform, which contributed $20.3 million to the total annual rise of $35.1 million. The segment’s gross mix increased to 34%, up from 27.5%.
| Segment | Q1 FY2027 | Q1 FY2026 | Dollar increase | Share of increase |
|---|---|---|---|---|
| On Device Solutions | $110.0 mln | $95.4 mln | $14.5 mln | 41.5% |
| App Growth Platform | $56.6 mln | $36.3 mln | $20.3 mln | 57.9% |
| Eliminations | $(0.6) mln | $(0.8) mln | $0.2 mln | 0.6% |
| Total | $166.0 mln | $130.9 mln | $35.1 mln | 100.0% |
Interim CFO Josh Kinsell noted the appearance of “meaningful operating leverage.” Cash operating costs increased by just 7%. The non-GAAP gross margin improved by 2.1 percentage points. Investing.com
Outlook was raised, with profit forecasts growing at a quicker pace. Revenue midpoint was up 3.1%, while the adjusted EBITDA midpoint advanced 7.1%.
| Metric | Prior FY2027 range | New FY2027 range | Midpoint increase | Implied Q2-Q4 quarterly average |
|---|---|---|---|---|
| Revenue | $630–$650 mln | $650–$670 mln | $20 mln, equivalent to 3.1% | $161.3–$168.0 mln |
| Adjusted EBITDA | $135–$145 mln | $145–$155 mln | $10 mln, representing 7.1% | $34.2–$37.5 mln |
The outlook does not extrapolate first-quarter margin over the year. The midpoint suggests a 22.7% EBITDA margin for the full year. Average EBITDA for the second through fourth quarters is lower than the $42.5 million posted in the first quarter.
The surge has pushed shares past most analyst price targets. Benchmark’s $15 target was the sole estimate left above the $12.15 premarket price. Shares remained around 11% under the yearly peak of $13.60.
| Analyst | Firm | Target date | Price target | Upside/(downside) from $12.15 |
|---|---|---|---|---|
| Daniel Kurnos | Benchmark | July 22 | $15.00 | +23.5% |
| Rohit Kulkarni | Roth/MKM | July 21 | $11.50 | (5.3%) |
| Anthony Stoss | Craig-Hallum | May 27 | $10.00 | (17.7%) |
| Omar Dessouky | BofA Securities / Bank of America NYSE:BAC | May 27 | $7.50 | (38.3%) |
| Average, four analysts | $11.00 | (9.5%) |
Cash conversion posted gains as well. Operating cash flow rose over twofold to $17.9 million. Free cash flow climbed to $11.3 million. Debt declined by more than $8 million, falling to approximately $352.9 million.
Net leverage dropped to 2.5 times, down from over five times a year prior. This progress resulted in a 50 basis point reduction in pricing for the largest loan tranche.
Preliminary: Kinsell stated that a non-cash retained-earnings adjustment is still being considered for the Form 10-Q. This could affect the GAAP net loss, while non-GAAP numbers reported would remain unchanged.
Risks: Digital Turbine posted a GAAP loss of $3.2 million and maintains a high debt load. Revenue is largely dependent on a few key customers. After-hours trading may result in wider bid-ask spreads and reduced liquidity.
Investors are now focused on whether performance can be sustained. Strong app growth composition and steady margins may lead to upward revisions. However, if these trends reverse, maintaining the 28% rally could become more challenging.
Related articles: Earnings