
NEW YORK, August 5, 2026, 05:06 EDT — U.S. regular session ended; Nasdaq premarket showing activity.
- Shares of Intel ended Tuesday at $100.86, gaining 10.84%. The stock was last at $98.41 in premarket trading at 5:00 a.m. EDT, falling 2.43%.
- Just 5.1% of Intel Foundry’s revenue in the second quarter came from external customers. The division posted a $2.1 billion loss.
- Shares of Advanced Micro Devices NASDAQ:AMD dropped 7.4% in premarket trading, even as the company projected higher-than-expected sales for the third quarter.
Intel’s market capitalization rose by approximately $50 billion on Tuesday, according to an initial estimate. The stock advanced by $9.86 per share, with about 5.04 billion shares in circulation. Shares finished trading up 10.84% at $100.86.
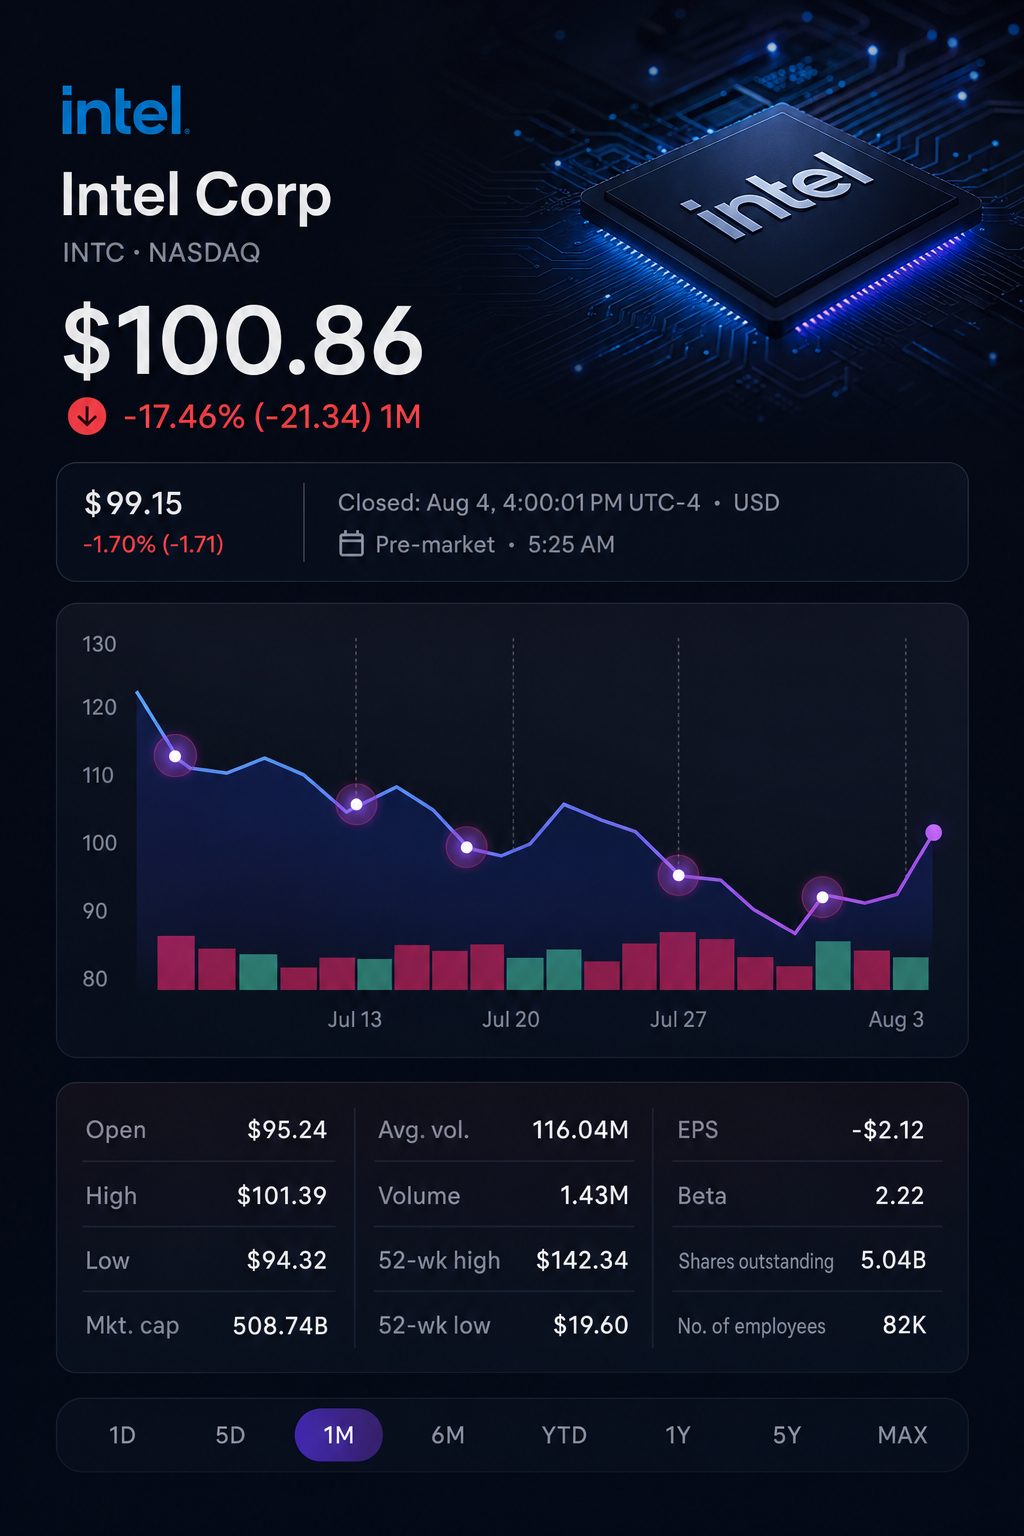
The surge outperformed the semiconductor index by 4.29 percentage points. However, Intel saw a trading volume of 124.4 million shares, falling short of its 65-day average. This trend indicates a high-beta recovery rather than new company-specific validation.
The difference is significant. Intel has yet to provide substantial evidence for its foundry business. External foundry revenue for the second quarter reached $293 million, representing only 5.1% of the segment’s sales. The division posted an operating loss of $2.1 billion.
Latest movement in Intel shares
| Period | Intel performance | Comparison or context |
|---|---|---|
| July 27–31 | -2.3% | Versus the prior full week of trading |
| August 3 | +0.9% | Ended session at $91.00 |
| August 4 | +10.84% | PHLX Semiconductor Index up 6.55% |
| August 5, 5:00 a.m. EDT | -2.43% premarket | Pre-market indication at $98.41 |
Returns are based on closing prices and represent early calculations.
Beneath last week’s slight overall drop were sharp daily moves. Intel dropped 5.1% on Wednesday, soared 11.3% on Thursday and eased lower again on Friday. The stock closed the week down 2.3%.
Intel’s earnings from its processor divisions are supporting its investment in manufacturing. Client operating profit totaled $2.3 billion, while data-center operating income stood at $2.5 billion. According to Intel’s segment reporting, the foundry segment’s loss accounted for 43.8% of the combined profit from those units.
Intel’s operating breakdown for the second quarter
| Segment | Revenue | Operating profit or loss | Implied operating margin |
|---|---|---|---|
| Client Computing and Physical AI | $8.9 billion | $2.3 billion | 25.8% |
| Data Center and AI | $6.3 billion | $2.5 billion | 39.7% |
| Intel Foundry | $5.8 billion | -$2.1 billion | -36.2% |
| External foundry business | $293 million | Not broken out individually | 5.1% of foundry revenue |
Margins and the proportion of external sales are based on initial estimates. Segment revenue reflects internal sales and is not meant to be totaled.
Chief Executive Lip-Bu Tan stated, “AI is driving unprecedented demand for compute.” Intel reported a 25% increase in total revenue for the quarter. Its Data Center and AI segment revenue surged 59%, and adjusted earnings were 42 cents per share. Intel Corporation
AMD reported second-quarter revenue up 50% at $11.5 billion. Data-center segment sales surged 107% to $6.7 billion. Despite these gains, AMD shares declined ahead of Wednesday’s market open.
Bernstein analyst Stacy Rasgon noted that “expectations had moved higher following Intel’s results a couple of weeks ago.” AMD’s response highlights the limited tolerance investors have for anything less than strong AI figures. Reuters
Intel against AMD
| Metric | Intel | AMD |
|---|---|---|
| Q2 revenue | $16.1 billion | $11.5 billion |
| Q2 revenue growth | 25% | 50% |
| Data-center revenue | $6.3 billion | $6.7 billion |
| GAAP gross margin | 40.4% | 54% |
| GAAP operating margin | 11.1% | 17% |
| Q3 revenue guidance midpoint | $16.3 billion | $13.0 billion |
| Estimated equity value as of Tuesday’s close | $508.6 billion | $855.7 billion |
| Market capitalization / annualized Q3 guidance | 7.8 times | 16.5 times |
Preliminary equity valuations and sales multiples are shown. The multiple is based on one quarter’s guidance, annualized, without accounting for debt, cash, or variations in business composition.
Intel trades at a lower price based on that basic sales metric. However, its growth is more sluggish and its profitability is weaker. The lower valuation points to concerns about execution, rather than signaling that the stock is undervalued.
Capital requirements continue to be substantial. Intel increased its projected capital expenditures for 2026 to $20 billion, up from $18 billion. Chief Financial Officer Dave Zinsner stated that next year’s spending would be “up meaningfully.” Reuters
Intel has not scheduled any upcoming investor events. Key economic indicators ahead include July payroll data due on Friday and consumer inflation numbers expected next Wednesday. Both could affect yields and chip-related stock valuations.
Upcoming week: key events for investors
| Date and time | Event | Intel relevance |
|---|---|---|
| August 7, 8:30 a.m. EDT | July employment report | May influence rate outlook and tech sector valuations |
| August 12, 8:30 a.m. EDT | July consumer-price report | Checks inflation trends and cost of capital assumptions |
| Company calendar | No Intel event scheduled | Keeps shares subject to industry headlines and sector movement |
The schedule for releases is verified by the Labor Department and listed on Intel’s investor-relations calendar.
Risks: Foundry losses could stay elevated if external orders are sluggish. Setbacks in yield, increased capital requirements, export restrictions or softer PC demand may halt the rerating.
A sustained advance requires external foundry revenue to surpass losses. For now, Intel’s CPU earnings continue to serve as support. The rally on Tuesday gave the company more time, but not definitive evidence.
Related articles: NASDAQ:INTC