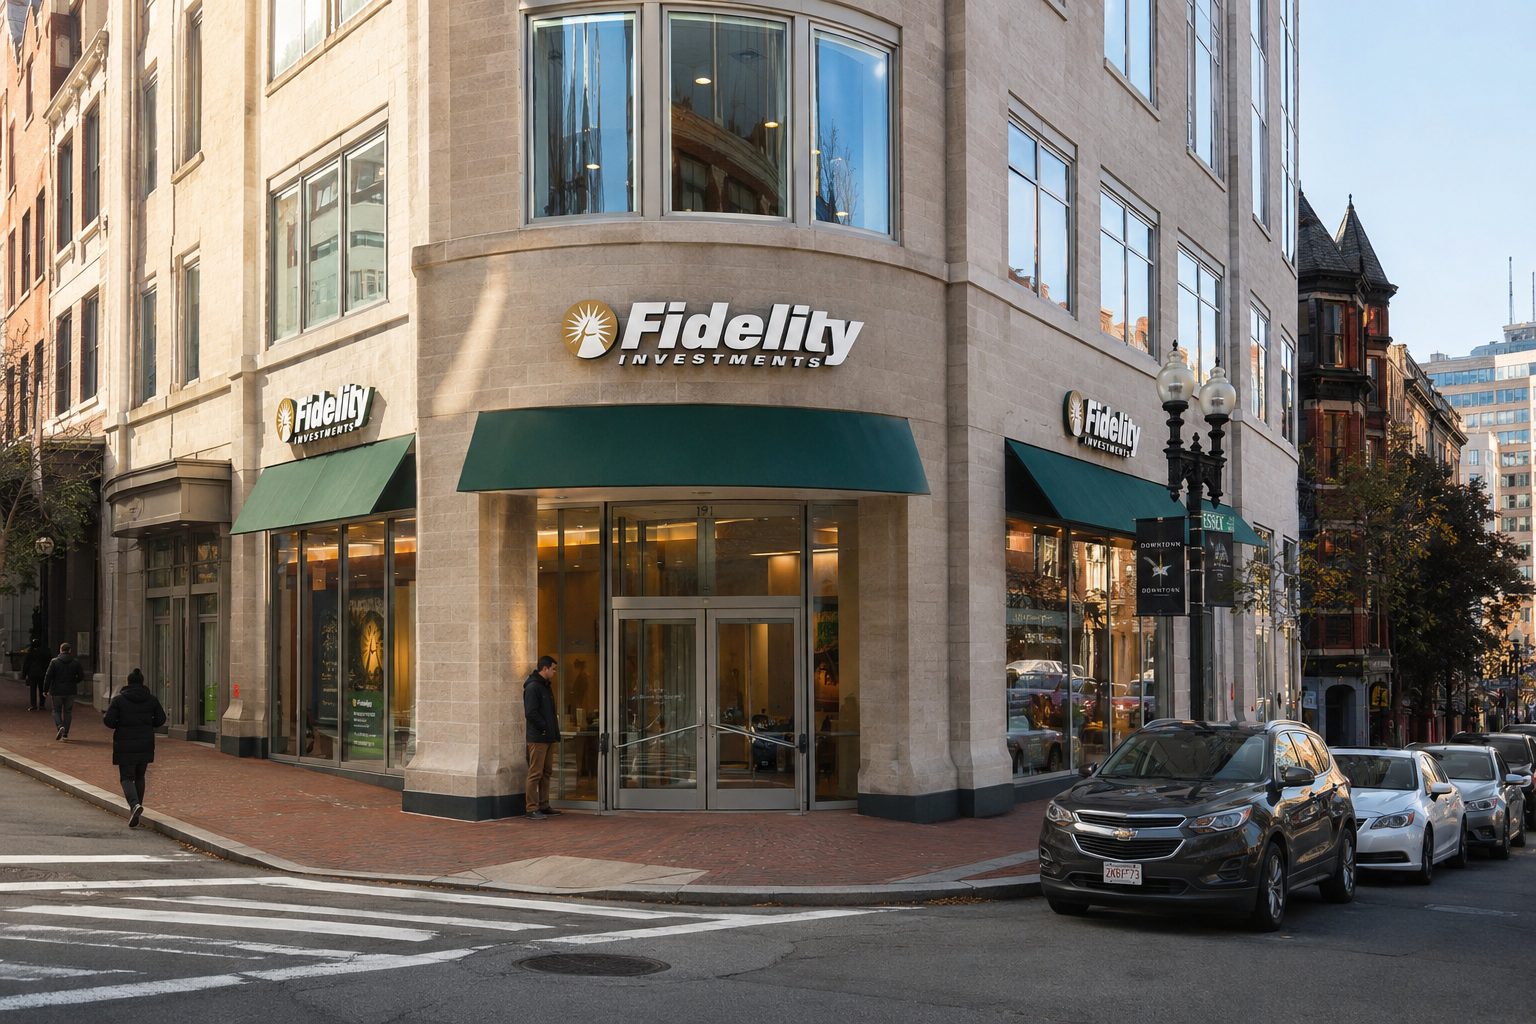

NEW YORK, August 15, 2026, 07:08 EDT
- Fidelity states the midterm cycle exists, though it is not a rule for trading.
- The S&P 500 finished Friday just 0.4% under its record close set on Thursday.
- Growth funds attracted flows, despite investors withdrawing funds from technology sectors.
Interest in “fidelity trading” searches has brought renewed attention to Wall Street’s traditional midterm-election trading strategies. The current environment is unusual, as U.S. stocks are trading close to all-time highs rather than experiencing the significant decline that typically underpins this pattern’s appeal.
Fidelity Investments, which is privately owned, notes that equities have tended to slip ahead of midterm elections and rebound once they are over. However, quantitative strategist Denise Chisholm warns that the cycle “isn’t a trading rule.” She emphasises that earnings performance and corporate investment are more significant factors. Fidelity’s midterm research
The distinction is important at this moment. The S&P 500 ended Friday at 7,785.76, slipping 0.17% following a record high on Thursday. Despite this, the index added 0.4% for the week, marking its third consecutive weekly gain.
| Index | Friday close | Friday | Week | 2026 |
|---|---|---|---|---|
| S&P 500 | 7,785.76 | down 0.17% | up 0.4% | up 13.7% |
| Nasdaq Composite | 26,729.16 | down 0.28% | up 0.1% | up 15.0% |
| Dow Jones Industrial Average | 53,732.41 | down 0.20% | down 0.6% | up 11.8% |
| Russell 2000 | 3,068.42 | up 0.51% | up 1.1% | up 23.6% |
The investor perspective highlights a divergence between cautious sentiment for the calendar and present allocations. U.S. equity funds recorded $2.58 billion in inflows for the week ending August 12. Growth funds attracted $8.78 billion, marking their best performance since November 2024.
| Fund category | Weekly net flow | Signal |
|---|---|---|
| U.S. equity funds | +$2.58 billion | Net inflow after prior outflow |
| Growth equity funds | +$8.78 billion | Biggest inflow since November 2024 |
| Value equity funds | +$1.79 billion | Inflow lags growth category |
| Technology sector funds | -$4.62 billion | Six-week inflow run ended |
| Bond funds | +$9.40 billion | Best inflow in four weeks |
| Money-market funds | +$13.92 billion | Inflows observed for second week |
The distinction is significant. Investors are generally purchasing growth, yet reducing exposure to technology-specific funds. This points to targeted risk-taking, instead of a clear election-related withdrawal.
Fidelity’s historical analysis similarly begins at a low point in earnings. Chisholm calculated an approximately 88% probability of positive 12-month returns following comparable declines in earnings growth. However, LSEG data shows that second-quarter S&P 500 profits are now up 52%.
| Analyst or strategist | Historical evidence | Recommendation |
|---|---|---|
| Denise Chisholm, Fidelity Investments | Market weakness during midterms has typically rebounded as policy uncertainty eases; similar earnings lows resulted in positive 12-month performance nearly 88% of the time | Advise against using the calendar as the central guide for market calls; emphasize focus on earnings and consumer spending |
| Goldman Sachs NYSE:GS strategists | Over 13 midterm years since 1974, median S&P 500 performance was flat from early August to Election Day; median gains hit 6% in the three months after elections | Anticipate muted trading ahead of elections, with stronger returns expected after |
| Venu Krishna, Barclays LON:BARC | Technology, growth and quality stocks outperformed in eight out of the last nine cycles following midterm elections | See short-term positioning pullbacks as buying chances, particularly for technology |
Valuations reduce the room for mistakes. The S&P 500 is trading at close to 20 times projected earnings, according to Reuters. That multiple is lower than the 22 times seen in January, but remains higher than the roughly 19 times recorded at the end of July.
The prior week sounded an alert. Softer retail sales along with elevated oil prices wiped out initial Friday gains. However, S&P 500 advancers led decliners by a ratio of 1.1 to one.
Economic data will take focus over politics next week. July housing starts are due on Tuesday, with the Federal Reserve releasing minutes from its July meeting on Wednesday.
Retail earnings are set to gauge the state of consumer sentiment. Softer results may reinforce a cautious stance ahead of November, while solid figures would bolster Fidelity’s argument that fundamentals are more important than the timing of the election.
Risks: Historical election trends rely on limited data and changing policy environments. Factors such as oil shocks, inflation, and high valuations may outweigh seasonal trends. Past results are not indicative of future outcomes.
Investors may benefit from waiting rather than taking a decisive position. The midterm pattern could be behind the recent volatility, but it has not yet provided a reason to buy on a dip that has not occurred.
Related articles: Stock Market