
NEW YORK, August 7, 2026, 05:09 EDT
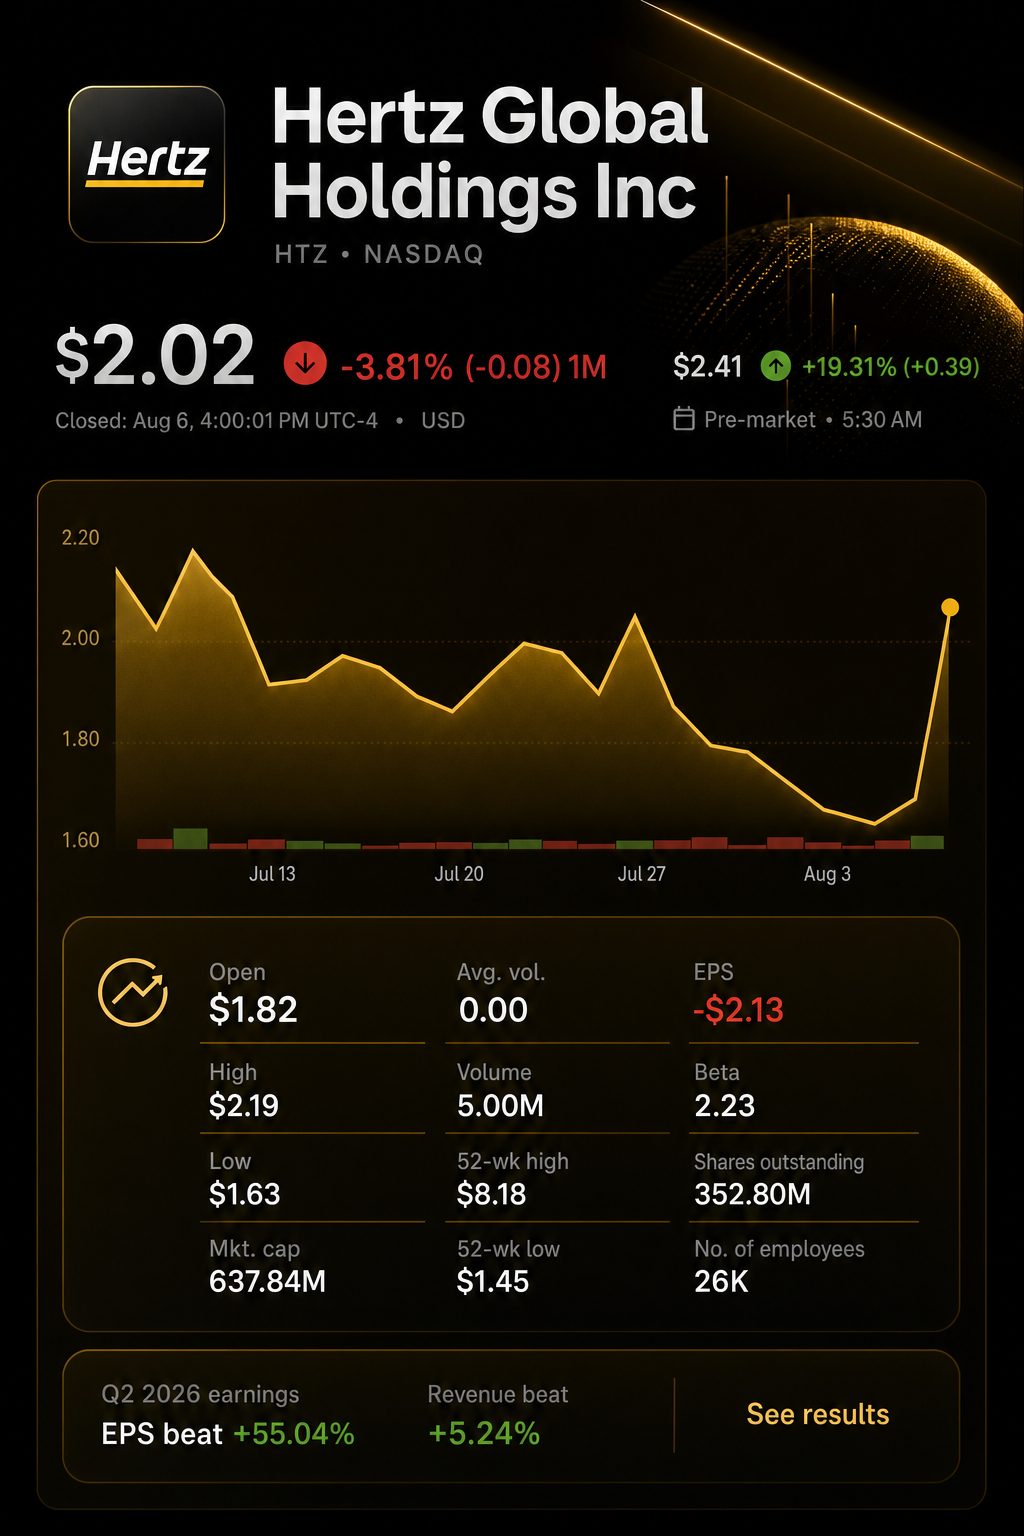
- Shares were set to open 21.8% higher at $2.46 during Friday’s premarket session.
- Revenue for the second quarter increased by 10%. The adjusted loss came in at 11 cents per share, compared with an anticipated loss of 24 cents.
- An initial reporter estimate attributes approximately 93% of reported revenue growth to pricing impact.
Hertz Global Holdings, Inc. NASDAQ:HTZ looked poised to continue its earnings rally on Friday. Second-quarter revenue increased by 10%, supported by stronger rental pricing instead of a rise in rental days. At 5:05 a.m. EDT, shares were up 21.8% at $2.46. Premarket trading showed high activity, as the main U.S. session had yet to start.
The combination is relevant for investors. Hertz maintained transaction days close to last year’s figure while running a fleet that was 1% smaller. Revenue per day at constant currency, or RPD, climbed 9%. Revenue per available vehicle was up 8%.
Market response and stance
| Measure | Reading | Investor context |
|---|---|---|
| Wednesday close | $1.56 | Level before results |
| Thursday close | $2.02 | Rose 29.5% |
| Friday premarket | $2.46 | Gained 21.8% |
| Move from Wednesday close | +57.7% | Calculated by reporter |
| Thursday volume | 155.8 million | Eight times the 65-day average |
| Short interest | 28.66% of float | Most recent disclosure, as of July 15 |
Premarket values are for reference. Figures are based on current market information.
Thursday’s trading volume was eight times higher than the 65-day average. As of July 15, short interest stood at 97.54 million shares, accounting for 28.66% of the float. This setup probably intensified the movement. However, it does not entirely account for the operational progress.
Hertz posted adjusted corporate EBITDA of $81 million, an increase of $63 million. Adjusted loss was reduced to 11 cents per share from 29 cents, outperforming the consensus loss estimate of 24 cents.
Q2 operating report
| Metric | Q2 2026 | Q2 2025 | Change |
|---|---|---|---|
| Revenue | $2.396 billion | $2.185 billion | Up 10% |
| Adjusted diluted EPS | $(0.11) | $(0.29) | $0.18 higher |
| Adjusted corporate EBITDA | $81 million | $18 million | Increase of $63 million |
| Adjusted EBITDA margin | 3.4% | 0.8% | Expanded by 260 basis points |
| Transaction days | 38.646 million | 38.695 million | No change |
| Average vehicles | 539,118 | 544,962 | Down 1% |
| Revenue per day | $61.98 | $56.89 | Rise of 9% |
| Revenue per unit/month | $1,542 | $1,429 | Up 8% |
| Depreciation per unit/month | $302 | $256 | Increase of 18% |
| Adjusted operating expense/day | $37.49 | $36.13 | Up 4% |
An initial reporter bridge allocates approximately $196.7 million to increased RPD. Days of transactions holding steady led to a revenue drop of around $2.8 million. The impact from pricing represented 93% of the $211 million overall rise in reported revenue.
Initial constant-currency revenue breakdown
| Driver | Calculation | Estimated contribution |
|---|---|---|
| Increase in RPD | 38.646 million days × $5.09 gain | +$196.7 million |
| Change in transaction days | 49,000 fewer days × previous RPD | -$2.8 million |
| Revenue growth at constant currency | Sum of pricing and volume | +$193.9 million |
| Currency and reporting reconciliation | Difference between reported and constant-currency growth | +$17.1 million |
| Total reported revenue growth | $2.396 billion minus $2.185 billion | +$211.0 million |
Reporter estimates are based on company data rounded to nearest values. This does not constitute an official company reconciliation.
The gain from pricing exceeded the pace of cost inflation. Adjusted direct operating expenses climbed by $51 million, while vehicle depreciation and lease charges were up $72 million. The estimated pricing impact was 1.6 times greater than the combined increase. Hertz’s RPD-to-operating-cost spread widened by 17% to about $24.36.
Chief Executive Gil West said, “This quarter’s results reflect the disciplined execution of our strategy and our consistent commercial strength.” Recalls cut adjusted EBITDA by approximately $30 million, impacting an average of about 15,000 vehicles, representing an increase of nearly 300% from a year earlier. Q4 Capital
GAAP net income rose to $64 million, following a loss of $294 million. However, the quality of earnings is still a concern. Management reported that GAAP profit was supported by sale-leaseback gains and revaluations of notes and warrants. On an adjusted basis, the company still posted a net loss of $47 million.
Hertz recorded stronger growth in revenue and revenue per day (RPD) than Avis Budget Group, Inc. NASDAQ:CAR. Avis maintained its profit margins by reducing its fleet size and decreasing its fleet cost per vehicle. The comparison indicates Hertz’s gains were driven by specific pricing strategies unique to the company.
Rental sector comparison
| Q2 metric | Hertz | Avis Budget | Read-through |
|---|---|---|---|
| Reported revenue growth | +10.0% | -1.3% | Hertz achieved revenue from higher pricing |
| Rental or transaction days | Flat | -2.3% | Volume remained secondary for both |
| Constant-currency RPD growth | +9.0% | +0.3% | Hertz saw significant benefit |
| Average fleet change | -1.1% | -4.9% | Avis reduced fleet more aggressively |
| Utilization | 79.0% | 72.6% | Definitions not aligned |
| Monthly depreciation/fleet cost | $302, +18% | $290, -4% | Fleet cost pressure still higher for Hertz |
| Adjusted EBITDA margin | 3.4% | About 9.5% | Avis holds a stronger margin |
The definitions used by the companies vary. Avis’s margin is based on a reporter’s calculation, using adjusted EBITDA of $286 million and revenue totaling $2.998 billion.
Cash conversion declined. Adjusted free cash flow dropped to $162 million compared with $327 million previously. Net spending on revenue-earning vehicles rose to $1.059 billion from $923 million. Corporate liquidity measured $984 million, falling from $1.489 billion at year-end.
Management projected significantly higher profitability for the third quarter, anticipating adjusted corporate EBITDA to be between $275 million and $325 million, with positive earnings per share for the quarter. Transaction days are expected to rise by approximately 1%, meaning unit economics will remain the primary driver of earnings.
Management perspective
| Metric | Q3 2026 | Full-year 2026 | 2027 |
|---|---|---|---|
| Adjusted corporate EBITDA | $275 million-$325 million | $225 million-$275 million | $1 billion goal |
| Transaction-day growth | Near 1% | Roughly 2% | Limited growth projected |
| Depreciation per unit/month | $285-$295 | Nearly $300 | Below $300 target |
| Earnings | EPS positive | — | Net income positive outlook |
| Free cash flow | — | Generation expected in second half | Anticipated positive full year |
| Year-end liquidity | — | $1.0 billion-$1.4 billion | — |
Management stated that achieving the $1 billion 2027 EBITDA target would require further scale.
Analysts continue to take a cautious stance. The latest data lists no Buy or Overweight ratings. Six analysts have assigned Hertz a Hold, while three have a Sell rating. The median target stands at $2.65, representing just a 7.7% premium to Friday’s indicative premarket level. These numbers could shift following reviews of the results.
Analyst ratings and target prices
| Recommendation or target | Current reading | Comparison or implication |
|---|---|---|
| Buy | 0 | No change from three months earlier |
| Overweight | 0 | Reduced from 1 |
| Hold | 6 | No variation |
| Sell | 3 | No change |
| Consensus | Underweight | No change |
| Low target | $1.00 | 59.3% below $2.46 |
| Median target | $2.65 | 7.7% higher than $2.46 |
| Average target | $3.09 | 25.6% higher than $2.46 |
| High target | $5.50 | 123.6% above $2.46 |
Reporter estimates for implied returns are based on the indicative $2.46 premarket price.
Risks: As of June 30, Hertz reported $6.04 billion in non-vehicle debt, including $200 million maturing in December 2026. Depreciation remains higher than its long-term goal, and both recalls and used-vehicle prices may change rapidly. The company also held roughly $247 million of unused ATM equity capacity, but management has excluded expected ATM proceeds from its liquidity estimates. Additional equity sales may result in shareholder dilution.