NEW YORK, July 31, 2026, 04:21 EDT — Premarket trade has begun on Nasdaq, with standard hours starting at 09:30 EDT.
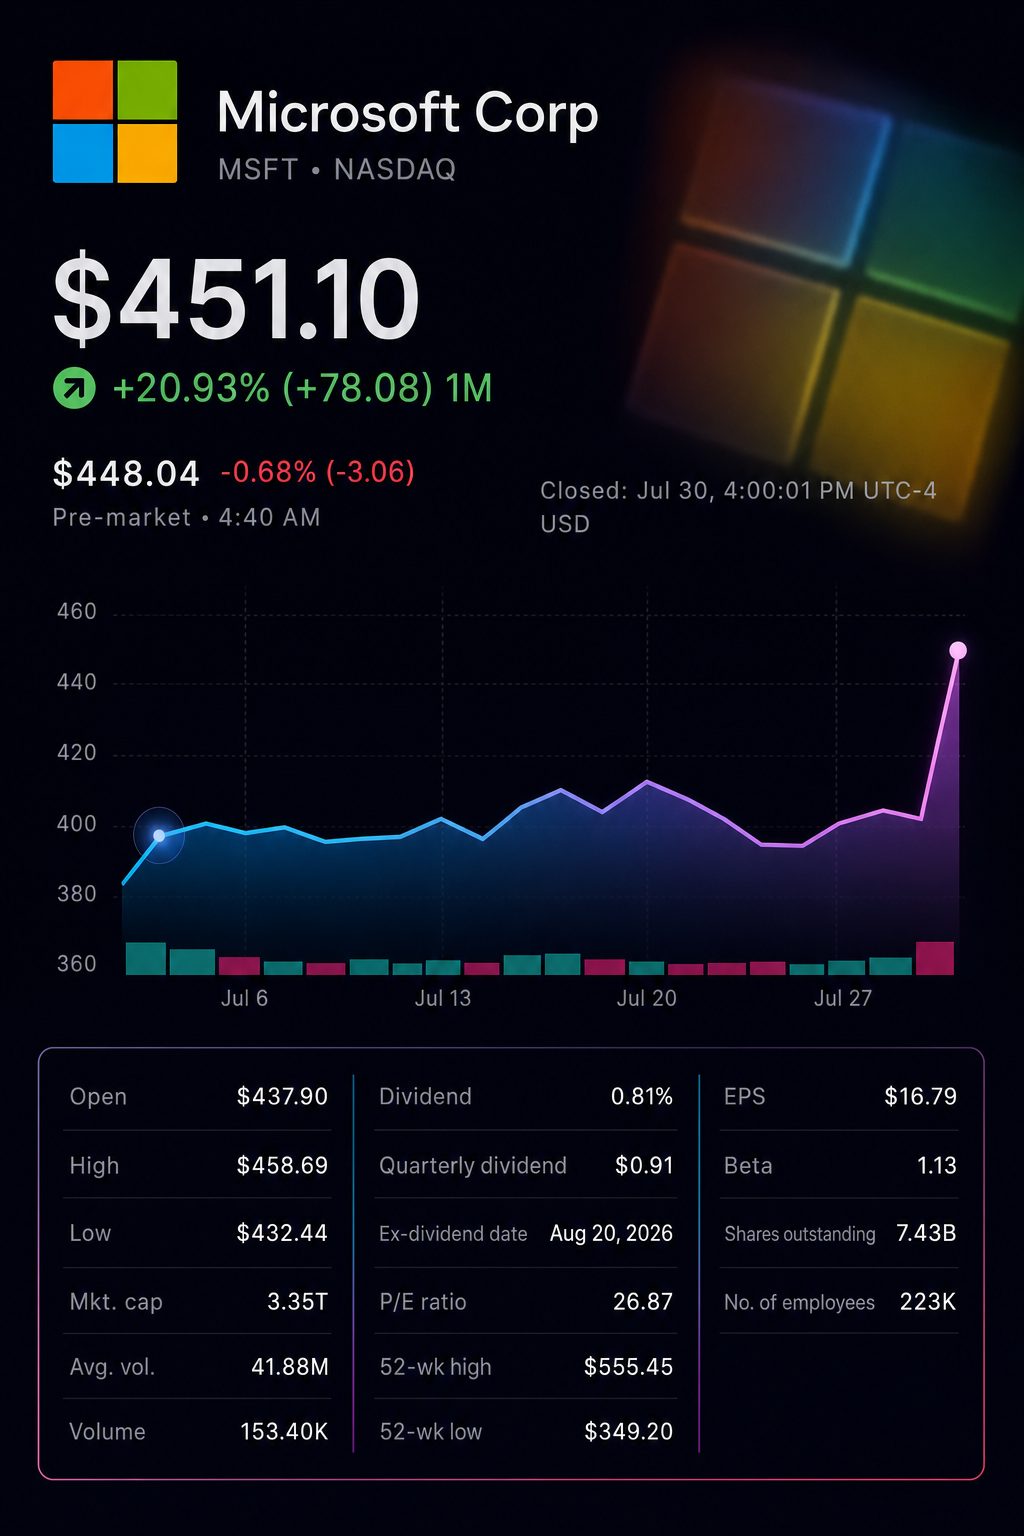
Microsoft NASDAQ:MSFT increased its market capitalization by almost $450 billion on Thursday, marking a new record. Meta Platforms NASDAQ:META saw an estimated drop of approximately $120 billion, according to an initial assessment.
The split was not due to differences in sales growth. Meta reported a 28% increase in revenue, while Microsoft posted an 18% rise.
Repricing was led by cash conversion. Microsoft generated free cash flow 25 times higher than Meta, with just 32% greater stated capital expenditure. The total change in market value neared $570 billion, though this is an initial calculation.
The end-of-day tape reflected the adjustment.
Thursday close
Microsoft
Meta
Share price
$451.10
$539.03
One-day move
up 15.51%
down 7.95%
Market value
$3.35 trillion
About $1.37 trillion
Market-value change
up nearly $450 billion
down around $120 billion
Meta’s loss and the total shift are initial estimates using closing figures.
Microsoft’s rally lifted the wider market. The Nasdaq advanced 2.78%, the S&P 500 improved by 1.66%, and the Dow climbed 1.19%.
Microsoft posted higher revenue and earnings. Meta saw stronger growth but a drop in operating profit. Both companies’ reporting periods concluded June 30. Microsoft released financials for its fiscal Q4, while Meta reported calendar Q2 figures.
Quarter ended June 30
Microsoft
Meta
Revenue
$90.01 billion
$60.80 billion
Revenue growth
18%
28%
Operating income
$40.60 billion
$18.78 billion
Operating margin
45%
31%
GAAP EPS growth
32%
−13%
Reported capital spending
$41.00 billion
$31.08 billion
Meta’s margin decline was not driven only by increased AI-related expenses. The quarter also recorded $2.40 billion in legal charges and $1.18 billion in severance expenses.
Despite that backdrop, the cash shortfall persisted. Nearly all of Meta’s operating cash flow was used up by its capital expenditures, while Microsoft maintained a substantially higher buffer.
Cash conversion
Microsoft
Meta
Operating cash produced
$55.40 billion
$31.86 billion
Declared capital expenditure
$41.00 billion
$31.08 billion
Available free cash
$19.60 billion
$0.784 billion
Free-cash-flow as margin
21.8%
1.3%
Capital spend per operating cash flow
74.0%
97.6%
Free-cash-flow shift, year-over-year
−23%
−91%
Ratios use figures reported by the company. Free-cash-flow levels did not see improvement. Investors favored Microsoft’s residual cash reserves rather than overall growth in cash flow.
Microsoft reported improved demand outlook, with commercial remaining performance obligations rising to $678 billion, an increase of 84%. Without OpenAI contributions, the growth was 25%.
Azure posted a 43% gain in revenue. Microsoft forecasts roughly 45% growth in constant currency for the current quarter. More than 30 million paid seats for Microsoft 365 Copilot were reported. Chief Executive Satya Nadella stated customers could “turn tokens into business results.” Microsoft
Zacks Investment Management chief market strategist Brian Mulberry attributed the gains to “the cloud and AI divisions.” The average target price increased to $560.90 after nine brokerages raised their estimates. Reuters
Meta’s ad business maintained strong momentum. The number of ad impressions climbed 14%, and the average cost per ad grew by 12%. Daily active users totaled 3.60 billion, a rise of 3%.
Meta’s strategy for profits from AI was more ambiguous. Executives mentioned enterprise services and compute sales but did not provide specific figures for short-term income. Josh Gilbert, lead analyst for Asia-Pacific at eToro, said Meta was “spending like a hyperscaler without a hyperscaler’s business model.” Reuters
Expenditure will remain elevated. Microsoft projects over $50 billion in capital spending for the first quarter. Its forecast for calendar-2026 stands at roughly $175 billion following the lease reclassification. Meta reduced its 2026 projection to between $130 billion and $145 billion, and set third-quarter revenue guidance at $61 billion to $64 billion.
Microsoft also surpassed a significant milestone. Previously, Nvidia NASDAQ:NVDA set the record with a $441 billion increase on April 9, 2025.
Risks: Microsoft forecasts an increase in capital expenditures for fiscal 2027. Meta notes that youth-focused legal proceedings in the U.S. might lead to a significant loss. A potential weakening of AI demand would challenge their investment strategies.
How is the U.S. market positioned ahead of Friday’s opening bell?
On Thursday, the S&P 500 ended the session up 1.66% at 7,437.63. The Nasdaq finished with a 2.78% rise to 25,122.18, and the Dow advanced 1.19%. S&P futures were tracking 0.42% higher at 3:50 a.m. Eastern. Nasdaq 100 futures advanced 1.09%, and Dow futures increased 0.53%. This suggests a stronger start, but not necessarily a positive close.
What factors are pushing the market upward today?
Major technology stocks are leading gains ahead of Friday’s market open. Microsoft surged over 15% on Thursday, lifting its market value by approximately $450 billion. Amazon posted 20% sales growth and a 37% increase at AWS, pushing its stock up nearly 9% in after-hours trading. Apple declined 5.5% after projecting slower-than-anticipated revenue growth for the September quarter. The takeaway: investors are prioritizing concrete results rather than solely AI-related investments.
Is the current rally widespread or mainly limited to the technology sector?
No. Thursday's surge was still largely driven by megacap technology shares. The technology sector advanced 5.2%, outpacing all other S&P groups. Over 70% of S&P 500 components finished lower in the session. The S&P 500 equal-weighted index dropped 0.8%, even as the benchmark index advanced. In broader exchange data, advancing stocks led decliners by 2.2 to 1. These different measurements track different sets of stocks, so their readings are not conflicting.
Are rising interest rates likely to end the stock-market rally?
The Federal Reserve maintained its target range at 3.50%–3.75% on Wednesday, with a 9–3 split among policymakers. Three members advocated for an immediate 25 basis point hike. Early Friday futures trading signaled about a 62%–64% chance of an increase in September. These probabilities shift constantly and do not reflect official commitments from the central bank. On Thursday, the 10-year Treasury finished at 4.68%, while the 30-year concluded at 5.21%. Elevated long-dated yields continue to exert the most significant valuation pressure on equities.
Does the most recent GDP data point to either stagflation or a recession?
Gross domestic product rose at a 1.5% annualized rate in the second quarter, easing from 2.1% in the previous quarter. Private domestic final sales recorded a stronger 3.9% gain. Personal consumption expenditures inflation for the quarter hit 5.1% annualized, with core inflation at 3.4%. This combination points to weaker headline growth, resilient demand, and persistent inflation pressure. The initial data does not confirm a recession. This advance estimate is subject to revision on August 26.
Have U.S. stocks become overpriced?
Stocks appear pricey, even as this quarter’s reported corporate earnings remain particularly robust. The S&P 500 is currently valued at nearly 20 times projected earnings for the next twelve months, compared to a ten-year average near 19 times. According to LSEG, the index is set for about 40% second-quarter earnings growth. FactSet’s July 24 projection put that figure at 37.9%, or 25.9% with Alphabet removed. Alphabet’s GAAP results reflect a $98 billion unrealized gain from investments. Robust earnings are supporting stock prices, while elevated bond yields are capping further gains in valuations.
What level of volatility is being priced in by the options market?
The VIX was at 16.87 in early trading Friday, down from its close at 17.09 on Thursday. This level suggests average daily swings near 1.1% when annualized with standard methods. At Thursday’s S&P close, that points to a move of about 79 index points. The VIX gauges movement magnitude only, not direction. The index currently sits far closer to its yearly low of 13.38 than to its high of 35.30. Options markets continue to show caution, but there are no signs of pronounced panic.
What economic data could shift market momentum today?
The Employment Cost Index for the quarter is due at 8:30 a.m. Eastern, with economists projecting a 0.8% rise after a previous 0.9% increase. The Chicago business barometer will be released at 9:45, with expectations centered around 55–56. Michigan’s final consumer sentiment reading for July follows at 10:00 a.m. The preliminary July sentiment index registered at 54.4, compared to 49.5 in June. A higher wage figure could put additional pressure on bonds and high-priced growth shares.
What is the short-term outlook for the S&P 500?
The base scenario remains slightly higher through early August but continues to show volatility. Premarket futures point to another potential move toward the 7,500 cash-index level. Resistance can be found at 7,620.90, which marked the 52-week high on June 2. Support is located near 7,313.92, the intraday low registered on Wednesday. If the index closes above 7,621 for a sustained period, it would reinforce the breakout argument. In contrast, a close below 7,314 would cast doubt on Thursday’s rebound. Although earnings are supportive of gains, elevated rates and narrow market breadth temper optimism.
Leokadia Głogulska is a financial and technology journalist at TS2.tech. Her coverage ranges from stocks and artificial intelligence to space technology and developments across global markets. She graduated from Wrocław University of Economics and Business and worked in financial analysis before becoming a business journalist.