
NEW YORK, August 10, 2026, 06:06 EDT — Plug Power (PLUG) traded higher in U.S. premarket hours as investors looked to upcoming earnings and monitored the company’s cash position.
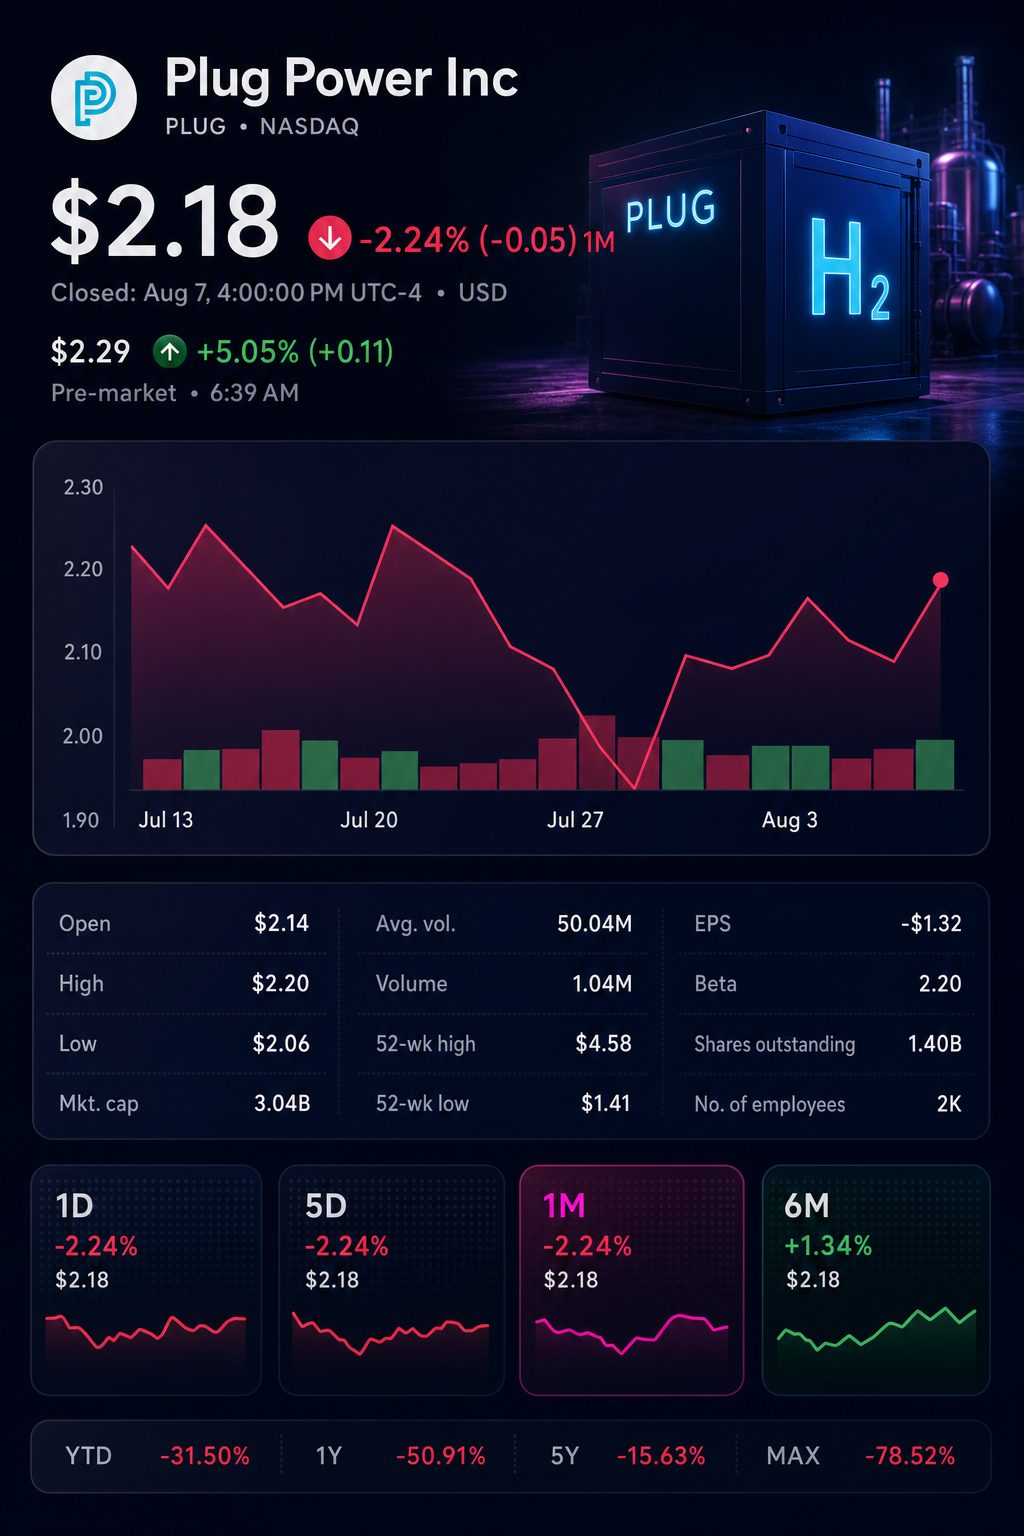
- The stock climbed 5.3% to $2.30, building on a 4.8% increase from the previous week.
- Early projections indicate revenue between $169.1 million and $172.8 million, with a projected loss of eight cents.
- Unrestricted cash at the end of June was approximately $162 million, not accounting for anticipated proceeds from asset sales.
Shares of Plug Power Inc. NASDAQ:PLUG gained 5.3% ahead of Monday’s opening bell. The hydrogen producer will post its second-quarter earnings results after markets close, with its conference call scheduled for 4:30 p.m. ET.
Sales projections suggest limited growth ahead. The key focus is whether improved margins can help cut cash consumption. June’s cash reserves were nearly a quarter of the operating cash burned during the first quarter.
| Market measure | Latest reading |
|---|---|
| Premarket price, 06:02 EDT | $2.30 |
| Premarket change | up 5.28% |
| Friday close | $2.18 |
| Friday change | increased 5.31% |
| Five-day return | up 4.81% |
| Nasdaq weekly return | added 5.2% |
| Year-to-date return | gained 10.66% |
| Float sold short | 24.79% |
Data reflects market activity up to August 10 premarket and short interest as of July 15.
Preliminary projections vary among vendors. MarketBeat lists revenue at $169.1 million, while Finnhub, as referenced by Quiver, reports $172.8 million. Both sources indicate an expected per-share loss of roughly eight cents.
| Financial measure | Q2 2026 preliminary | Q1 2026 actual | Q2 2025 actual |
|---|---|---|---|
| Revenue | $169.1M-$172.8M | $163.5M | $174.0M |
| Per-share result | $(0.08) | GAAP $(0.18) | GAAP $(0.20) |
| Adjusted per-share result | — | $(0.08) | — |
| GAAP gross margin | — | (13%) | (31%) |
These estimates are not official company projections. Different data providers may use different per-share reporting methodologies.
Within that revenue span, sales are expected to increase by 3.4%-5.7% compared to Q1, but decline 0.7%-2.8% from the prior year. The anticipated loss represents a 60% improvement versus last year’s 20 cents.
Liquidity offers a clearer snapshot. As of June 30, Plug reported around $162 million in unrestricted cash. In the first quarter, the company used $150 million in operating cash.
Basic calculations indicate that June cash equals 1.08 times the Q1 operating cash outflow. This does not represent a runway estimate. The ratio can shift rapidly due to asset sales, working capital changes, and quarterly timing.
| Liquidity measure | Amount | Change or status |
|---|---|---|
| Unrestricted cash, Dec. 31, 2025 | $368.5M | Initial level |
| Unrestricted cash, March 31, 2026 | $223.2M | Dropped 39.4% |
| Unrestricted cash, June 30, 2026 | About $162M | Fell 27.4%; early figure |
| Q1 operating cash use | $150.0M | Rose 42.1% from previous year |
| Expected near-term incremental liquidity | More than $80M | Contingent; not included in June total |
The importance of the distinction was evident in Q1. GAAP gross margin climbed 42 percentage points to negative 13%, but operating cash consumption increased 42% compared with the same period last year.
On July 13, CEO Jose Luis Crespo outlined the company’s main priorities, saying: “The improvement in margins, effective management of our liquidity, and the growth of our sales pipeline remain our critical focus.” Plug Power
The update projected over $80 million in additional short-term liquidity. The Texas deal remained subject to closing conditions. The New York deal is still scheduled to proceed in stages through March 2027. Monday’s filing is expected to provide further details.
FactSet’s latest recommendation breakdown continues to show caution.
| Analyst rating | Count |
|---|---|
| Buy | 6 |
| Overweight | 1 |
| Hold | 11 |
| Underweight | 1 |
| Sell | 3 |
| Consensus | Hold |
| Average price target | $3.48 |
| Median price target | $3.50 |
| Target price range | $0.75-$7.00 |
FactSet figures as reported by The Wall Street Journal.
The mean price target suggests a 59.6% gain from Friday’s close. However, the highest target is 9.3 times greater than the lowest, illustrating considerable divergence in outlooks for cash flow and profitability.
Direct competitors Ballard Power Systems Inc. NASDAQ:BLDP and FuelCell Energy Inc. NASDAQ:FCEL are likewise trading below yearly highs. Plug delivered the largest gain on Friday.
| Company | Friday close | Friday change | Below 52-week high |
|---|---|---|---|
| Plug Power | $2.18 | up 5.31% | 52.4% |
| Ballard Power Systems | $2.62 | up 2.75% | 60.1% |
| FuelCell Energy | $20.43 | up 0.54% | 46.1% |
Plug’s market capitalization stood at approximately $3.04 billion when markets closed on Friday, representing about 4.3 times its projected 2025 revenue. Nearly 25% of the company’s float was sold short, which could amplify the effect of any earnings surprise.
The primary driver this week comes following Monday’s close. Management remains committed to achieving positive EBITDAS in the fourth quarter. Investors await confirmation that improved margins are translating into cash flow.
Risks: Plug continues to operate at a loss and uses up cash. Asset sales are subject to conditions for closing. The outlook could shift rapidly depending on hydrogen demand, policy backing, timing of projects, or ability to secure financing.
Related articles: NASDAQ:PLUG