
NEW YORK, August 10, 2026, 06:06 EDT
- Class B shares increased by 0.4% to $524.05 prior to Monday’s market open.
- Berkshire’s average price for Class B shares in May and June was $485.95.
- A reported currency fluctuation contributed approximately 66% to operating profit growth in the second quarter.
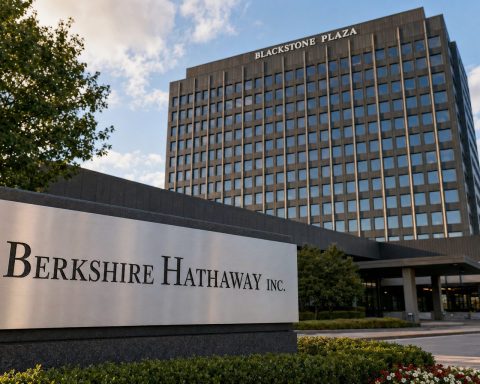
Berkshire Hathaway Inc. NYSE:BRK.B Class B shares were up 0.4% to $524.05 in premarket trading on Monday. The uptick was recorded on a volume of 23,173 shares, with the main session yet to start.
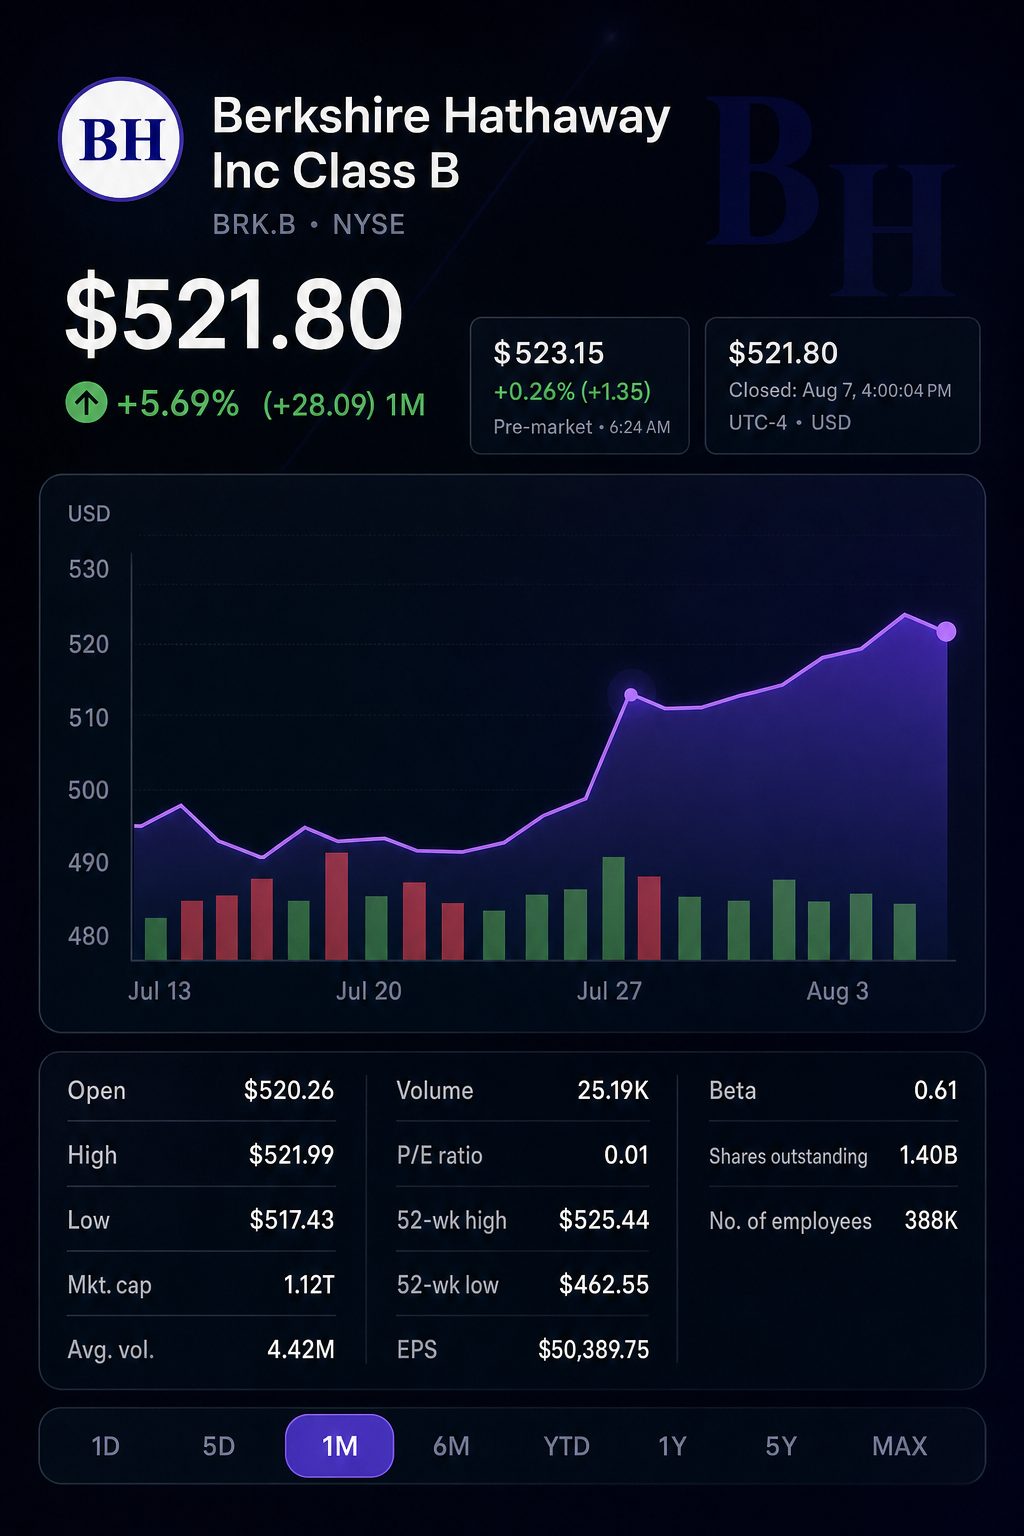
Investors may find clearer insight beneath the earnings headline. Berkshire acquired 8.60 million Class B shares across May and June, paying a weighted average price of roughly $485.95. By Friday’s close, the price was 7.4% higher than that amount.
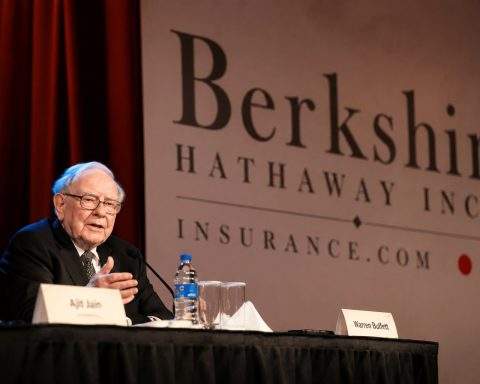
The difference is significant. Berkshire’s guidelines allow for buybacks when shares trade below intrinsic value, as cautiously determined by Chief Executive Greg Abel with input from Chairman Warren Buffett. There is no official minimum price set by the policy, and the specific prices paid in July have not been revealed.
| Class B reference | Shares bought back | Average paid | Aug. 7 closing premium |
|---|---|---|---|
| May 2026 | 1,458,312 | $476.01 | 9.6% |
| June 2026 | 7,139,881 | $487.98 | 6.9% |
| Weighted May–June | 8,598,193 | $485.95 | 7.4% |
| Close on Aug. 7 | — | $521.80 | — |
Net income surged to $25.67 billion, more than twice the previous amount. This figure included $12.68 billion in investment gains, with most unrealized. Berkshire reiterated its caution that quarterly investment results may present a distorted view of overall earnings.
Operating profit is also worth scrutinising. It climbed 16.3% to $12.98 billion. Still, nearly 66% of that gain came from a $1.203 billion positive movement on non-dollar debt.
Excluding only the specified currency line gives an estimated growth of 5.2%. This figure is based on analytical calculations and is not an adjusted measure reported by the company.
| Q2 operating earnings bridge, $bn | 2025 | 2026 | Change |
|---|---|---|---|
| Operating earnings reported | 11.160 | 12.983 | +16.3% |
| Non-dollar debt currency component | -0.877 | +0.326 | +1.203 swing |
| Excluding the currency component | 12.037 | 12.657 | +5.2% |
Capital deployment surged rapidly. Berkshire bought back $4.5 billion in shares over the quarter, in addition to over $3.3 billion worth in July. This represents at least 29% of the company’s highest-ever annual repurchase total of $27 billion logged in 2021.
Berkshire switched to being a net purchaser of equities for the first time in 15 quarters, acquiring almost $20 billion more in shares than it sold. Among its acquisitions was an additional $10 billion investment in Alphabet Inc. NASDAQ:GOOGL.
Cash and Treasury assets totaled $364.7 billion at the end of June, declining from the all-time high of $380.2 billion reached in March. The June total did not reflect the $6.8 billion homebuilder purchase finalized in July.
Preliminary estimate: removing the impact of that acquisition and the lowest disclosed July buybacks results in a mechanical balance of $354.6 billion. This figure does not factor in July operating cash flow, settlements, or additional investment transactions. It is not a true end-of-month cash total.
The performance across business segments varied. Manufacturing, services, and retailing contributed the most significant rise in dollar terms. Energy recorded the highest rate of percentage growth, whereas both insurance metrics decreased.
| After-tax operating earnings, $bn | Q2 2025 | Q2 2026 | Change |
|---|---|---|---|
| Insurance underwriting | 1.992 | 1.731 | -13.1% |
| Insurance investment income | 3.367 | 3.059 | -9.1% |
| BNSF railroad | 1.466 | 1.558 | +6.3% |
| Berkshire Hathaway Energy | 0.702 | 0.891 | +26.9% |
| Manufacturing, services and retailing | 3.601 | 4.470 | +24.1% |
GEICO reported a 45% decline in pre-tax underwriting profit, pressured by increased accident claims and rising advertising expenses. CFRA analyst Cathy Seifert described the performance as “absolutely abysmal,” adding that Allstate Corp. NYSE:ALL and Progressive Corp. NYSE:PGR were showing stronger results. Reuters
The importance of capital allocation to the stock story increases due to this weakness. Abel’s buybacks indicate cash deployment even as insurance results fluctuate. Buybacks also provide a clearer valuation indicator than unstable investment returns.
Analyst coverage is still limited and opinions are mixed. FactSet’s latest data reflects a neutral stance, whereas Barchart’s more limited sample is more favorable. Seifert maintained CFRA’s neutral rating, describing the quarter overall as “a pretty healthy beat.” The Wall Street Journal
| Research source | Coverage | Current recommendation | Detail |
|---|---|---|---|
| FactSet via WSJ | 7 analysts | Hold | 2 Buy, 4 Hold, 1 Sell |
| Barchart | 6 analysts | Moderate Buy | Average rating 3.67 out of 5 |
| CFRA Research | Named analyst | Neutral | Cathy Seifert |
Berkshire shares climbed 2.0% between July 31 and August 7. Over the same period, the S&P 500 (INDEXSP:.INX) advanced 3.6%, marking its best performance since April.
Several key tests are on the agenda in the coming week. July consumer price data will be released on Wednesday, August 12, at 8:30 a.m. EDT. Producer prices are due on Thursday, and retail sales figures are expected on Friday.
The releases have a direct impact on Berkshire. Its insurance investment income fell by 9.1% as a result of lower short-term rates. Retail demand influences the company’s dealerships, manufacturers, homebuilders and additional consumer-facing businesses.
Risks: The announced buyback prices reflect past transactions and do not indicate future obligations. Lower margins at GEICO, declining Treasury yields, tariffs, and reduced demand may limit additional capital deployment. Fluctuations in equity markets may also impact reported net income.
$485.95 could prove more significant than $25.67 billion when markets open on Monday. This figure represents the average price Berkshire paid for Class B shares in line with its intrinsic-value buyback strategy. On Friday, the market price reflected a 7.4% premium over that amount.
Related articles: NYSE:BRK.B