
SANTA MONICA, California, August 31, 2026, 19:35 EDT — Snap’s stock advanced 2.2% with its 7.5% cash-flow yield set to be tested as investors look for confirmation of a buyback.
- Snap ended the session at $5.55 with a gain of 2.21%, moving within a range of $5.43 to $5.69.
- With trailing free cash flow at $706 million, the yield on its $9.39 billion market capitalization stands at 7.5%.
- Buybacks in the first half totaled $601 million, 48% above free cash flow, with the share count remaining unchanged.
Shares of Snap Inc. NYSE:SNAP finished Monday up 2.21% at $5.55. The closing price placed the firm’s valuation near $9.39 billion following a volume of 42.4 million shares traded.
Snap’s current price equates to 13.3 times its trailing $706 million in free cash flow, resulting in a 7.5% cash-flow yield. Although it appears cheap, not all of that cash is available to shareholders.
In the first half, Snap repurchased $601 million worth of shares. This amount exceeded its free cash flow of $406.5 million by 48%. The company also issued $513.2 million in stock compensation.
Snap’s six-session close
NYSE closing price, U.S. dollars
As of . Source: Investing.com historical data.
The stock rose 5.9% compared to its August 21 close. Its trajectory was volatile, surging 7.1% on August 25 before dropping 8.5% a day later.
The company’s performance outpaced its stock movement. Revenue for the second quarter grew 19% to $1.60 billion. Advertising revenue advanced 9%, and other revenue surged 85% to $316 million.
Free cash flow increased to $121 million from $24 million. Adjusted EBITDA climbed to $250 million, up from $41 million. The firm, however, recorded a net loss of $164 million.
Cash generation versus equity costs
First half of 2026, millions of dollars
Source: Snap Q2 2026 results. Stock compensation combines Q1 and Q2.
The buybacks achieved their short-term objective. As of June 30, Snap’s outstanding common shares totaled 1.682 billion, the same as a year before. However, the company used more cash on repurchasing shares than it generated from operations.
This results in the 7.5% yield being less attractive than it initially seems. Snap had $2.66 billion in cash and securities, compared with $3.53 billion in debt. Factoring in net debt raises the trailing free-cash-flow multiple to nearly 14.5 times.
Monetization continues to be uneven. Out of Snap’s 493 million daily active users, only 92 million were from North America. The company’s quarterly revenue per user in the region reached $10.26, which was tenfold higher than the figure for the rest of the world.
User scale and monetization gap
Q2 2026 daily active users and quarterly ARPU
North America
Europe
Rest of world
Source: Snap Q2 2026 supplemental metrics.
Users outside North America increased by 12%, while those in North America declined by 7%. As a result, stronger ad pricing is required to compensate for revenues. The overall average revenue per user was up 13% to $3.25.
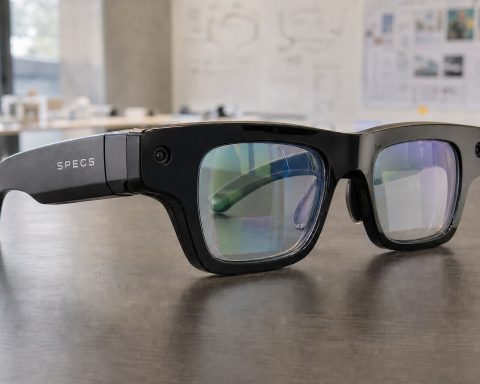
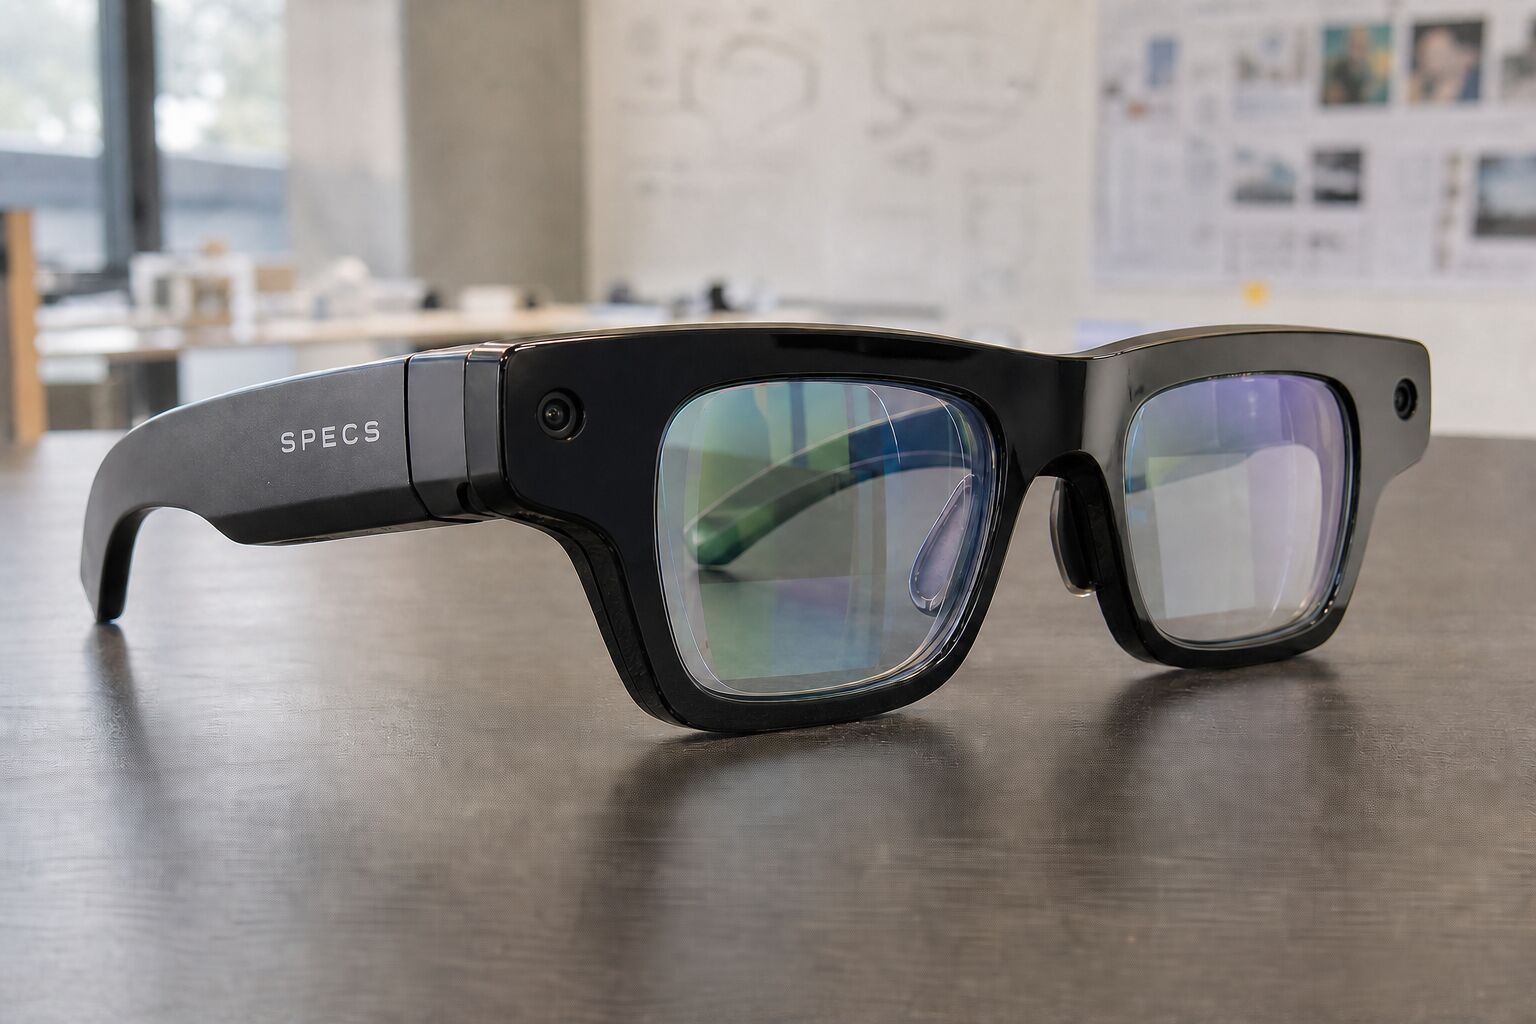
Chief Executive Evan Spiegel stated Snap is “investing with discipline to increase free cash flow per share over time.” Specs, its augmented-reality glasses, are now part of that strategy. SEC-filed prepared remarks
Snap does not provide separate figures for Specs-related spending. Research and development costs totaled $542 million in Q2, accounting for 34% of revenue. The firm has scheduled a launch event for September 16 and anticipates a commercial release later this fall.
In the coming week, investors are set to assess that level of spending alongside the recovery in core advertising. Snap forecast third-quarter revenue in the range of $1.70 billion to $1.74 billion. The midpoint for its adjusted EBITDA stands at $325 million, indicating a margin of roughly 18.9%.
Risks: Advertising demand may decline rapidly. Specifications might need greater investment than stated, and lawsuits over youth safety have the potential to increase expenses. More aggressive share repurchases could also reduce cash reserves if stock-based compensation remains elevated.
Related articles: NYSE:SNAP