
NEW YORK, August 6, 2026, 12:03 p.m. EDT — U.S. stock markets begin trading.
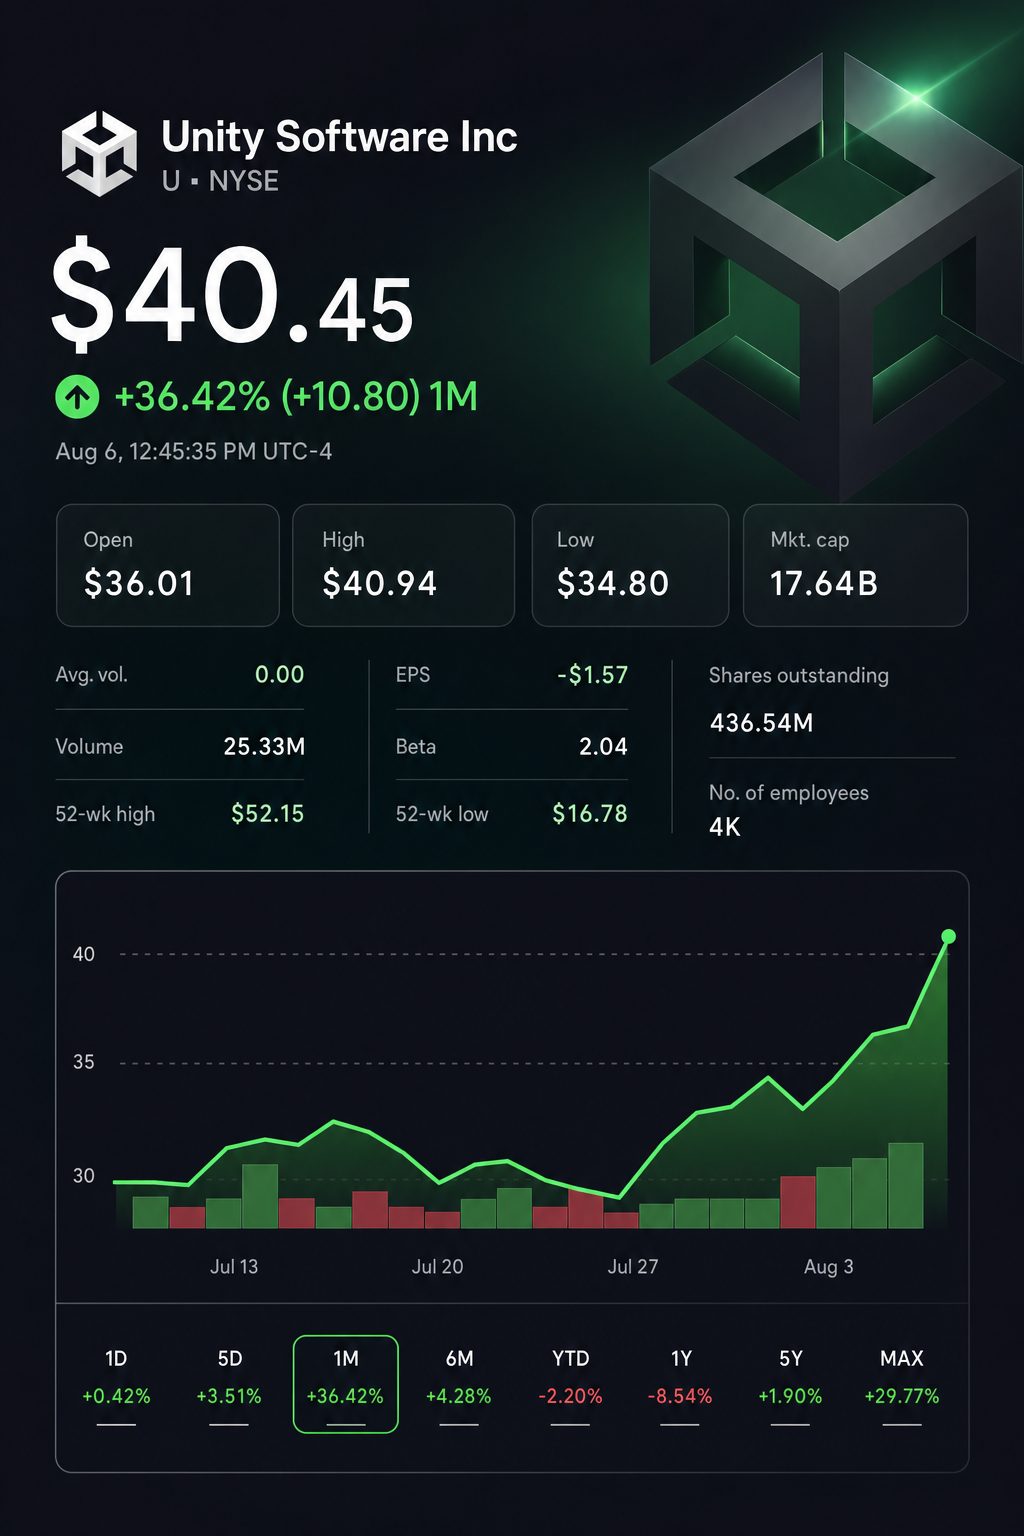
- Unity was last up 14.0% at $40.42, having climbed as high as $42.70 earlier in the session.
- Unity Technologies reported revenue of $546 million for the second quarter, with adjusted EBITDA totaling $160 million.
- Strategic revenue accounted for 89% of total sales. Shares were 9.5% higher than the average analyst estimate.
Shares of Unity jumped 14.0% to $40.42 as of 11:48 a.m. EDT, after the company reported revenue, EBITDA and cash flow ahead of expectations. Trading volume hit 22.6 million shares, over double the 65-day average.
Quality of revenue advanced as growth continued. Strategic revenue climbed 38%, accounting for 89% of overall sales, compared with roughly 80% a year prior.
The market quickly factored in much of the improvement. Unity shares changed hands at $40.42, 9.5% higher than the average analyst target of $36.91. The difference underscores the significance of any analyst target changes following results.
Unity exceeded the upper range of its May forecasts on all key metrics.
| Metric | Q2 2026 actual | May guidance | Above high end | Q2 2025 |
|---|---|---|---|---|
| Total revenue | $546.5 mln | $505–$515 mln | $31.5 mln / 6.1% | $440.9 mln |
| Strategic revenue | $486.4 mln | $455–$465 mln | $21.4 mln / 4.6% | $351.9 mln |
| Adjusted EBITDA | $160.2 mln | $130–$135 mln | $25.2 mln / 18.7% | $90.5 mln |
The analysis relies on reported data and Unity’s guidance from May. Percentages reflect company-provided information.
Chief Executive Matt Bromberg described it as “arguably the best quarter in Unity’s history as a public company.” Growth was led by the Grow segment, which posted the strongest operating metrics. Strategic Grow revenue climbed 63%. Unity Technologies
The revenue breakdown indicates the source of the acceleration.
| Revenue category | Q2 2026 | Q2 2025 | Year-on-year change | 2026 share | 2025 share |
|---|---|---|---|---|---|
| Strategic Grow | $329.0 mln | $201.3 mln | +63% | 60.2% | 45.7% |
| Strategic Create | $157.5 mln | $150.6 mln | +5% | 28.8% | 34.2% |
| Total strategic | $486.4 mln | $351.9 mln | +38% | 89.0% | 79.8% |
| Non-strategic | $60.1 mln | $89.0 mln | -33% | 11.0% | 20.2% |
| Total revenue | $546.5 mln | $440.9 mln | +24% | 100% | 100% |
Create posted a growth rate of 5%. When a one-time $12 million item from last year is excluded, growth stands at 14%.
Grow accounted for 60% of the quarter’s revenue, rising from 46%. Create’s proportion dropped, even as its dollar contribution rose slightly. Unity’s growth increasingly depends on advertising driven by Vector.
The outlook for the third quarter indicates a further pronounced move toward strategic products.
| Q3 measure | Company guidance | Q2 actual | Sequential change |
|---|---|---|---|
| Strategic revenue | $540–$550 mln | $486.4 mln | 11% to 13% higher |
| Strategic Grow | $380–$385 mln | $329.0 mln | Up 16% to 17% |
| Strategic Create | $159–$163 mln | $157.5 mln | Increase of 1% to 4% |
| Non-strategic revenue | About $20 mln | $60.1 mln | Down roughly 67% |
| Implied total revenue | $560–$570 mln | $546.5 mln | 2% to 4% higher |
| Adjusted EBITDA | $185–$190 mln | $160.2 mln | 15% to 19% higher |
| Strategic revenue mix | 96.4%–96.5% | 89.0% | Gain of around 7.5 points |
Total revenue and mix data are based on Unity’s outlook. Non-strategic revenue accounts for about one month of contributions from Supersonic, which was sold on August 4.
Revenue is projected to be $565 million at the midpoint of guidance, with adjusted EBITDA seen at $187.5 million. This represents a margin of approximately 33.2%, compared to 29.3% reported in the second quarter.
Cash conversion saw further gains. Free cash flow increased by 59% to $202 million. The attributable GAAP loss was reduced to $23.6 million, compared to $108.8 million. Stock-based compensation declined to $75.6 million from $101.4 million.
Analyst ratings stayed optimistic ahead of widespread adjustments following earnings.
| Recommendation | Current | One month ago | Three months ago |
|---|---|---|---|
| Buy | 18 | 17 | 20 |
| Overweight | 3 | 3 | 1 |
| Hold | 9 | 9 | 10 |
| Underweight | 0 | 0 | 0 |
| Sell | 0 | 0 | 0 |
| Consensus | Overweight | Overweight | Overweight |
The average price target stood at $36.91. The median projection was $36, with the highest forecast at $54.
The consensus outlook stays positive. However, the present price is above both the average and median target levels. Any additional gains could hinge on upward estimate revisions rather than the current spread of recommendations.
Risks: Growth is increasingly dependent on Vector and mobile ad revenue. Strategic Create reported a 5% expansion. Unity continued to post GAAP losses, and adjusted EBITDA figures left out significant compensation and amortization expenses.
The upcoming challenge is third-quarter performance. Strategic revenue needs to increase approximately 12% quarter-over-quarter at the midpoint of guidance. As the portfolio streamlining is almost finished, Vector will need to deliver the majority of that expansion.