
SAN JOSE, California, August 26, 2026, 05:32 EDT — Zoom Video Communications (ZM.O) dropped 5.8% in premarket trade after it projected quarterly earnings per share of $1.47, missing analyst expectations.
- Zoom shares were priced at $95.06 ahead of Wednesday’s market open, marking a 5.8% decline from the previous session’s close.
- The third-quarter adjusted EPS guidance midpoint of $1.47 came in 2% below consensus estimates.
- Enterprise revenue climbed 7.8%, while Online revenue edged up 0.6%.
Zoom Communications (NASDAQ:ZM) dropped 5.8% ahead of the market open after its profit outlook for the latest quarter was below expectations. Shares traded at $95.06 at 05:30 EDT, compared to the previous session’s closing price of $100.92 premarket quote.
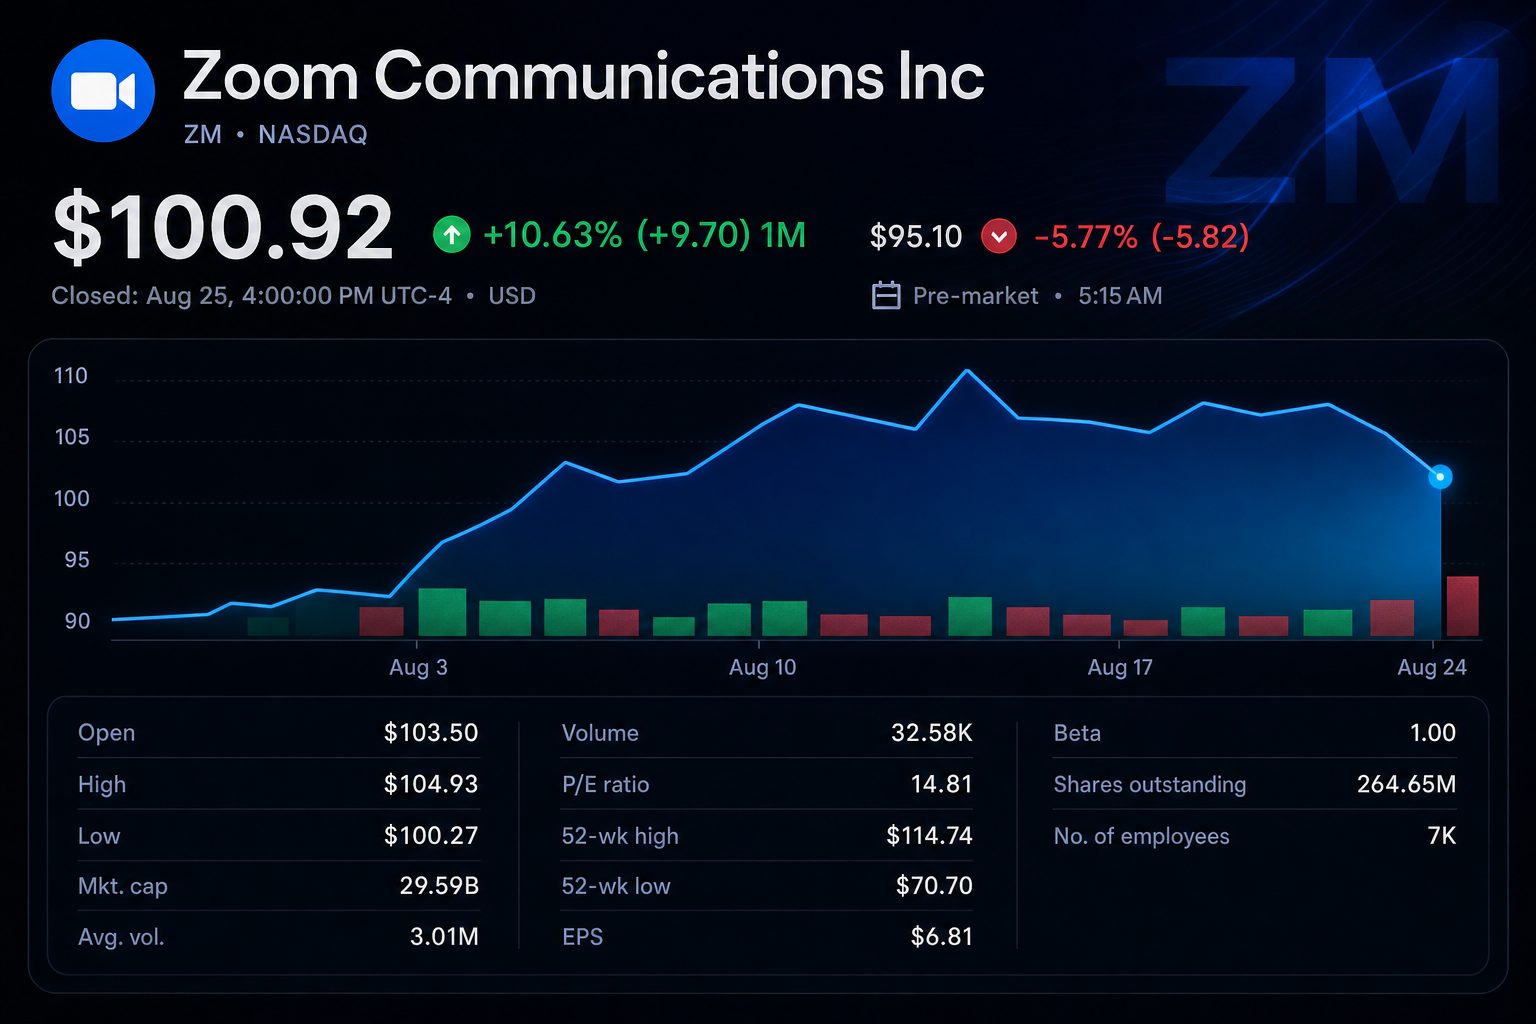
The drop wiped roughly $1.76 billion from Zoom’s implied market capitalization. This came after a 3.7% fall in regular trading on Tuesday, with volume at around 7.1 million shares—over double the latest daily average.
Investors paid attention to adjusted third-quarter earnings projected between $1.46 and $1.48 per share. The midpoint of $1.47 fell three cents short of analysts’ $1.50 forecast. Revenue guidance in the range of $1.275 billion to $1.280 billion was largely in line with market expectations Reuters.
Revenue for the second quarter increased by 4.9% to $1.277 billion. Adjusted earnings reached $1.55 per share. Both numbers topped Wall Street expectations, yet neither alleviated concerns about a weaker outlook for future profits.
| Investor measure | Reported or guided | Reference | Signal |
|---|---|---|---|
| Q2 revenue | $1.277 billion | $1.270 billion estimate | Beat by 0.6% |
| Q2 adjusted EPS | $1.55 | $1.48 estimate | Up 4.7% over forecast |
| Q3 adjusted EPS | $1.46-$1.48 | $1.50 estimate | 2.0% below midpoint |
| Q3 revenue | $1.275-$1.280 billion | $1.280 billion estimate | Roughly in line |
The divide was more pronounced. Enterprise revenue climbed 7.8% to $787.5 million, marking the fastest pace in three years. In contrast, online revenue edged up just 0.6% to $489.7 million Zoom results.
Enterprise accounted for 61.7% of revenue for the quarter. The number of customers generating over $100,000 annually rose by 8.2% to 4,625. Net dollar expansion rose by one percentage point to reach 99%, which continues to signal a slight contraction among the current customer base.
Chief Executive Eric Yuan reported that enterprise growth reached its highest point in three years. Customer numbers for Zoom Virtual Agent climbed 256%, reinforcing management’s argument for AI adoption. Revenue figures for the product were not released by the company.
Despite exceeding revenue expectations, cash generation slowed. Free cash flow dropped by 7.0% to $472.4 million, while operating cash flow was down 4.1% at $494.8 million.
At the end of July, Zoom held $7.2 billion in cash and marketable securities. The company bought back 3.7 million shares in the quarter. There is $1.3 billion left under its share repurchase authorization, representing roughly 4.6% of its premarket equity value.
Zoom projects full-year revenue in the range of $5.085 billion to $5.095 billion. The company anticipates adjusted EPS between $6.08 and $6.12. Forecasts for free cash flow stand at $1.78 billion to $1.82 billion.
Rivalry stays fierce. Microsoft (NASDAQ:MSFT) Teams and Alphabet (NASDAQ:GOOGL) Google Meet integrate collaboration tools within wider productivity platforms. Zoom needs to leverage AI for quicker growth while maintaining margins.
Prior to the earnings report, analysts held a positive outlook. Out of 28 firms surveyed, 16 rated the stock as Buy and 12 as Hold. The group’s average price target stood at $111.64, compared to a premarket price of $95.06 analyst consensus.
Risks: Premarket prices may move in the opposite direction due to lighter volumes. Share repurchase programs may lift per-share figures but do not equate to sustainable growth. Gains from strategic investments can also reduce the comparability of GAAP profit with core business performance.
The upcoming test focuses on performance relative to the $1.47 EPS midpoint. Enterprise activity and AI adoption continue to be evident. Investors are now looking for these advances to translate into renewed cash-flow growth.
Related articles: Earnings