QQQ Gains 3% with Adviser Filings Highlighting Conviction Rather Than New Fund Inflows
30 July 2026
1 min read

QQQ Gains 3% with Adviser Filings Highlighting Conviction Rather Than New Fund Inflows

NEW YORK, July 30, 2026, 11:05 EDT

  • U.S. cash markets remained open. QQQ was last at $681.65, rising 3.0%, as of 10:50 EDT.
  • Two alerts from late July refer to holdings as of March 31, rather than acquisitions in July.
  • The reported additions represent under 0.08% of QQQ volume as of Thursday morning.

Invesco QQQ Trust gained 3.0% to $681.65 during morning trading. However, two recent adviser notifications did not disclose any acquisitions taking place in July.
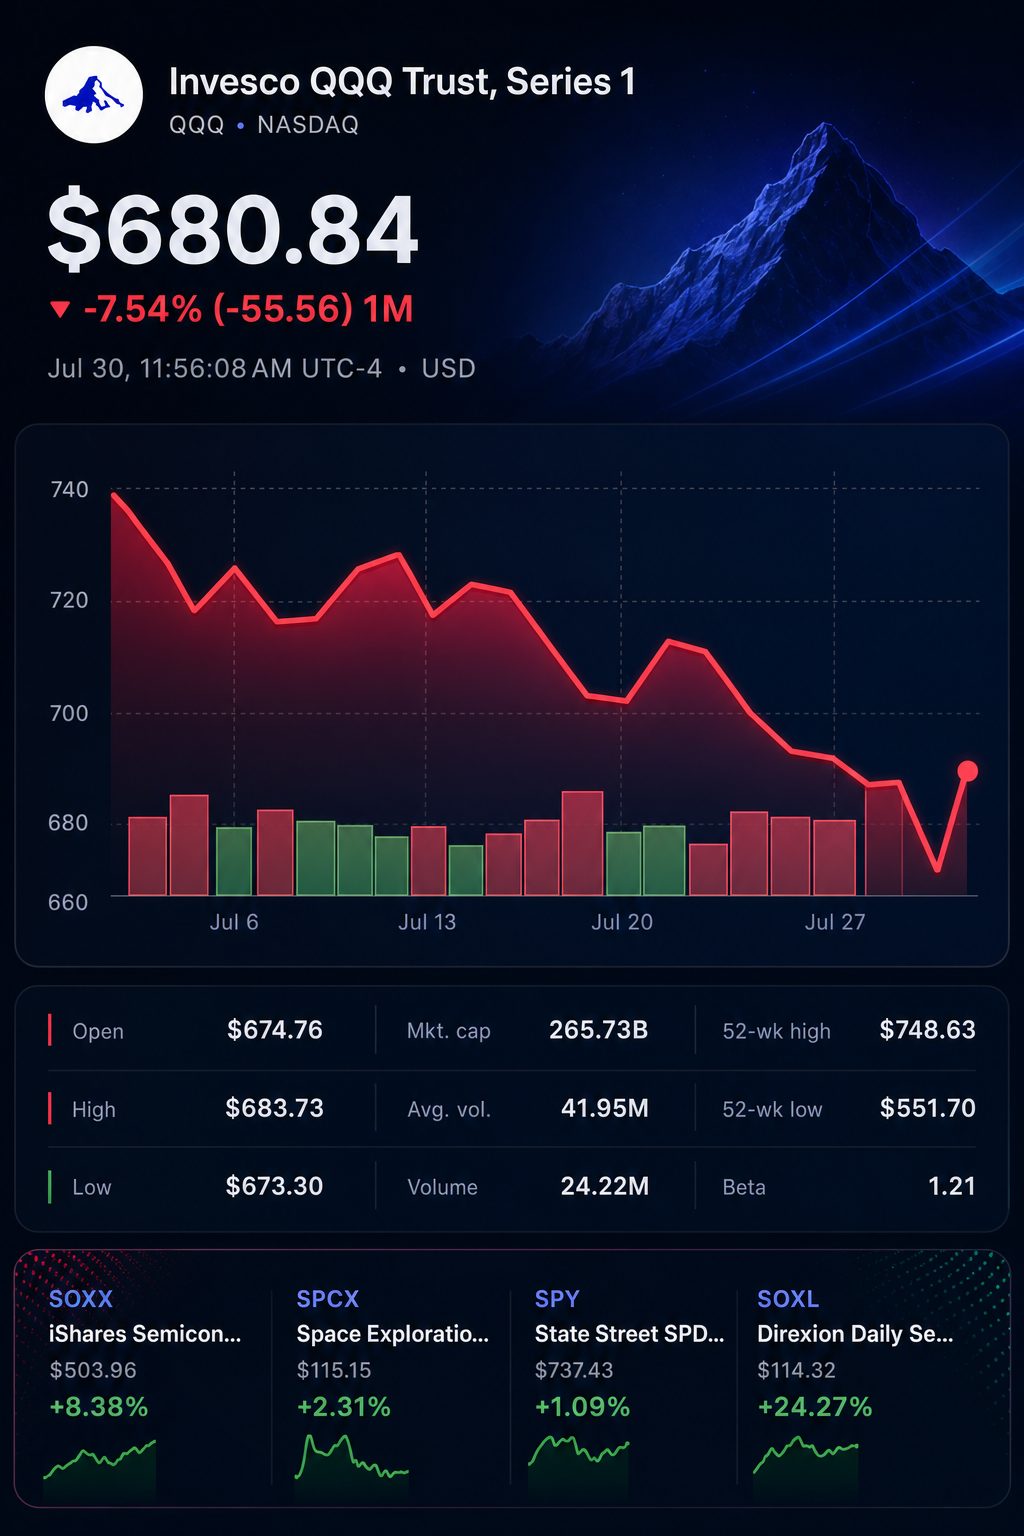
Stock chart for NASDAQ:QQQ

The rise in holdings is based on positions as of March 31. The filings indicate previous conviction rather than reflecting present ETF appetite.

In terms of flow analysis, dates are key. QQQ made up 5.2% and 7.3% of the respective portfolios. The portfolios collectively acquired 13,890 shares. This figure was under 0.08% of QQQ’s trading volume on Thursday morning.

QQQ holdings disclosed at quarter close

AdviserDec. 31 sharesMarch 31 sharesQuarterly changeMarch 31 valuePortfolio weight
Financial Insights25,42527,889Up 2,464, or 9.7%$16.10 million5.2%
Constant Guidance Financial6,95918,385Up 11,426, or 164.2%$10.61 million7.3%
Combined32,38446,274Up 13,890, or 42.9%$26.71 million5.9% weighted

Total holdings increased by 42.9% over the quarter. Constant Guidance accounted for 82% of the newly acquired shares.

The alerts are less effective as trading signals due to their timing. Both filings occurred in mid-May, but MarketBeat released the alerts 72 days afterward, which was 120 to 121 days following the end of the quarter.

Quarter-end holdings compared to Thursday’s price

MetricMarch 31July 30, 10:50 EDTChange
QQQ share price$577.19 implied$681.65+18.1%
Total shares46,274 reported46,274 assumed
Total position value$26.71 million$31.54 million preliminary+$4.83 million preliminary

The mark-to-market calculation is based on the premise that neither adviser made trades following March 31, an assumption that has yet to be substantiated. The full picture of holdings will become clearer with second-quarter disclosures.

The QQQ rallied on Thursday following fresh evidence. Shares of Microsoft Corporation jumped 15.4%, whereas Meta Platforms, Inc. dropped 9.2%.

Microsoft reported a 43% increase in Azure revenue, surpassing the consensus estimate of 39.98%. Free cash flow totaled $19.6 billion, higher than the projected $13.44 billion.

“It’s maintaining its position in the race,” said Dave Wagner, portfolio manager at Aptus Capital Advisors. Reuters

Meta reported a 28% increase in revenue, while free cash flow dropped to $784 million. Capital expenditures totaled $31.08 billion. Chief Executive Mark Zuckerberg stated, “AI is accelerating our core business today.” Meta Investor

Market comparison for Thursday morning

SecurityPriceDay moveMarket signal
Invesco QQQ Trust $681.65+3.01%Megacap-growth rally
Technology Select Sector SPDR Fund (NYSEARCA:XLK)$175.40+5.30%Technology outperformed
SPDR S&P 500 ETF Trust $737.29+1.07%Wider market trailed

XLK outperformed QQQ by roughly 2.3 percentage points, while SPY trailed QQQ by nearly two points. This divergence matched a recovery led by technology rather than widespread risk-on sentiment.

Risks: Advisers’ positions may not be the same as of March 31. Traders assigned a 57% probability to a rate hike in September. Apple Inc. and Amazon.com, Inc. are set to announce results after Thursday’s market close.

For investors, the filings indicate a concentration instead of an immediate buy signal. On Thursday, a clearer indicator was the increasing difference between AI-related expenditures and cash being generated.

TS2 TECH • EXTENDED COVERAGE

Further analysis

What is the current price of QQQ?

At about 11:02 a.m. Eastern on July 30, QQQ stood at $678.38, a gain of $16.65, or 2.52%, compared to its previous close of $661.73 on Wednesday. The price ranged between $661.89 and $683.68 during the session, covering roughly 3.3%. Around 20.4 million shares had changed hands by that point. All figures remained subject to significant change before market close with trading ongoing.

What is driving the sharp increase in QQQ today?

Microsoft surged 13.8% after its outlook alleviated worries over significant AI investment. In July 28 holdings, Microsoft accounted for about 4.9% of QQQ. This rise delivered an estimated 0.68 percentage point benefit to the portfolio through basic weighting. Nvidia climbed 2.3%, and the semiconductor index advanced close to 6.7%. Meta slid 8.7%, indicating the rally was not broad-based. Reuters

Does QQQ remain in correction territory following today’s bounce?

At Wednesday’s close, QQQ was 11.2% beneath its all-time closing high of $745.34 set on June 2. With shares at $678.38, the loss narrowed to roughly 9.0%. Closing near this price would lift it out of correction status according to the usual benchmark. Still, a 2.1% drop on Wednesday officially pushed the Nasdaq-100 into a correction. A single day of gains is not enough to establish a sustained reversal. Macrotrends

What is the current concentration level of QQQ?

On July 28, Apple, Nvidia, Microsoft, Micron, and Amazon collectively made up approximately 29.9%. Apple’s weighting stood at 8.42%, just ahead of Nvidia’s 8.03%. According to Invesco, the technology sector represented an average 67.29% share of QQQ throughout June. This level of concentration increases exposure to both robust earnings and the risk of individual stock setbacks. QQQ tracks major Nasdaq non-financial names, rather than representing the whole equity market. Schwab

Are QQQ shares considered pricey at their current valuation?

On June 30, Invesco’s trailing P/E ratio stood at 34.45, while the forward P/E was 25.09 and price-to-book ratio was 10.24. These valuation multiples continue to depend on robust earnings growth from key holdings. A decline in share price is beneficial only if projected profits hold steady. Valuation risk remains elevated following the recent pullback. Invesco

What QQQ price points are most important at present?

Initial resistance for today stands at $683.68, set at the session peak recorded around 11:02 a.m. The 20-day moving average is roughly $702.07, while the 50-day moving average comes in at $715.29. QQQ’s 100-day moving average is approximately $674.43, which aligns with immediate support. The close at $661.73 on Wednesday offers the next clear support marker. If that level is breached, the 200-day moving average near $644.59 gains significance. Barchart.com

What impact do economic indicators and interest rates have on QQQ?

The Federal Reserve kept its target range steady at 3.50% to 3.75% on Wednesday. Second-quarter real GDP grew at a 1.5% annualized rate, lower than in the previous quarter. PCE inflation for June eased to 3.7% year-on-year from 4.1% in May. The 30-year Treasury yield rose to approximately 5.21%, weighing on valuations of growth stocks. Slowing growth backs expectations for rate cuts, but ongoing inflation limits room for policy action. The outlook remains uncertain. Federal Reserve

What is the short-term outlook for QQQ’s price?

A likely base scenario features choppy action within a range of about $662 to $702, which includes Wednesday’s closing level and the current 20-day moving average. Closing above $684 could open the path to $702, and potentially $715. Falling below $662 might lead to a move toward the $645 zone, close to the 200-day average. Apple and Amazon, making up approximately 12.6%, were to release results after the close on Thursday. These levels represent scenarios, not probability-based forecasts. Barchart.com

How does QQQ present itself as a long-term investment opportunity?

Through June 29, QQQ posted a five-year cumulative return of 114.16%. The fund carries an expense ratio of 0.18% and yields roughly 0.44%. Longer-term performance aligns with earnings growth among leading market constituents. High valuations and sensitivity to interest rates can lead to significant short-term losses. Data indicate targeted growth exposure rather than full-market diversification. Previous returns do not guarantee performance going forward. Invesco

Mateusz Kaczmarek is a financial and technology journalist at TS2.tech, covering stocks, artificial intelligence, semiconductors and global market developments. A graduate of the Poznań University of Economics and Business, he previously worked in financial analysis before moving into business journalism. His reporting focuses on technology companies, market trends and the forces shaping global investment markets. Follow Mateusz Kaczmarek on Google News.

AI PORTFOLIO

Top Stock Picks

Today’s highest-ranked model selections.

#1 BUY ON PULLBACK

Microsoft

NASDAQ: MSFT 94 / 100
#2 BUY

L3Harris Technologies

NYSE: LHX 90 / 100
#3 BUY

Xylem

NYSE: XYL 89 / 100
#4 BUY IN TRANCHES

Lam Research

NASDAQ: LRCX 87 / 100
#5 BUY ON WEAKNESS

GE HealthCare

NASDAQ: GEHC 84 / 100
View full portfolio
Editorial model selection. Not personalised advice.
IREN Limited (NASDAQ:IREN) falls as $4 billion-plus AI ramp-up puts delivery to the test
Previous Story

IREN (NASDAQ:IREN) surges 26% as 5GW AI strategy intensifies valuation debate

Alphabet Shares (NASDAQ:GOOGL): Cloud Revenue Is Key to Reaching $420, Not a 16x Price-to-Earnings Ratio
Next Story

Alphabet Shares (NASDAQ:GOOGL): Cloud Revenue Is Key to Reaching $420, Not a 16x Price-to-Earnings Ratio