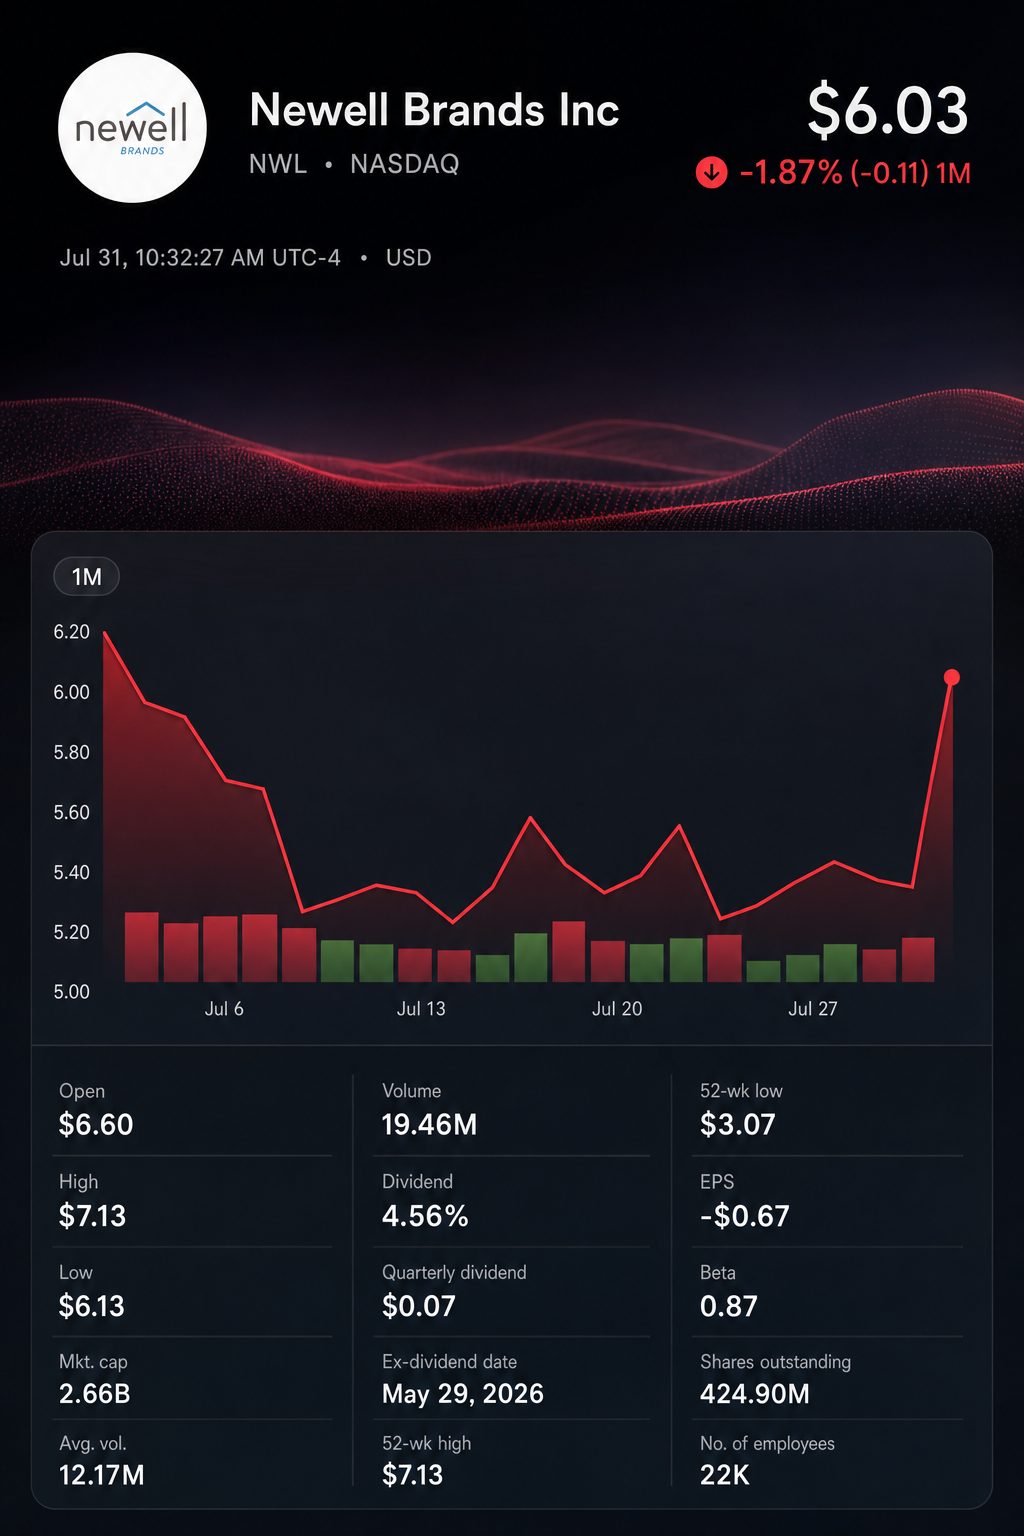
The stock climbed 25.3% to $6.44 in regular U.S. trading, after earlier touching $7.11.
Core sales rose 2.3%, breaking a streak of over four years with no growth.
Newell’s normalized EPS for the quarter was $0.42, with $0.21 attributed to tariff recoveries.
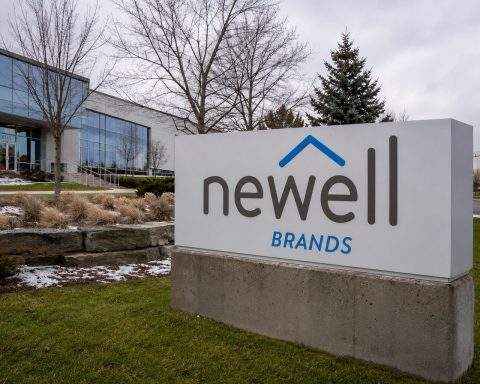
Shares of Newell Brands NASDAQ:NWL surged 25% during Friday’s regular session as sales resumed growth and executives lifted their forecast for 2026. However, year-on-year normalized EBITDA gains were matched by tariff-related recoveries.
The response in the market far exceeded just the refunded amount. Using current market figures, the estimated equity value increase is around $550 million, which represents approximately 4.4 times the $126 million in pretax recovery. This suggests traders are wagering on a sustained improvement in sales.
The stock changed hands at $6.44, after reaching an intraday high of $7.11, marking a 38% gain at its peak. Comparable consumer-product stocks were down.
The most recent trades took place between 9:54 and 9:57 a.m. EDT. Percentage changes reflect differences from quoted prices.
Sales for the second quarter climbed 3.0% to $1.994 billion. Core sales, which leave out the effects of currency fluctuations and portfolio adjustments, were up 2.3%. Analysts polled by FactSet projected revenue at $1.98 billion. GAAP earnings per share stood at $0.25, surpassing the expected $0.17.
Earnings quality showed mixed results. Newell recorded $100 million in IEEPA duties expensed in 2025, in addition to $26 million for duties in the first quarter of 2026. Combined, these recoveries contributed $0.21 per diluted share.
Metric
Q2 2026 stated
Q2 2025
Estimated Q2 2026 excluding recoveries
Ex-recovery change
Net sales
$1.994 bln
$1.935 bln
$1.994 bln
+3.0%
Normalized EBITDA
$406 mln
$280 mln
$280 mln
0.0%
Normalized EPS
$0.42
$0.24
$0.21
-12.5%
Normalized operating margin
16.2%
10.7%
9.9%
-0.8 percentage point
Calculated figures exclude the reported $126 million pretax recovery and $0.21 per share. These are estimated values, not metrics disclosed by the company.
With those recoveries deducted, normalized EBITDA remained flat. Estimated normalized EPS declined by 12.5%. The estimated operating margin decreased by roughly 80 basis points. Sales growth was the most consistently repeatable part of the quarter’s results.
Chief Executive Chris Peterson described the sales recovery as an “important milestone in our turnaround.” Chief Financial Officer Mark Erceg noted that gains in productivity and effective overhead management helped balance increased costs in commodities and transportation. Newell Brands
Learning & Development was the main contributor for the quarter. Core sales rose 4.9%, supported by baby and writing products. Outdoor sales increased as well, but its normalized margin decreased.
Operating segment
Q2 sales
Core-sales change
Normalized margin
Q2 2025 margin
Home & Commercial Solutions
$903 mln
-0.4%
7.5%
4.9%
Learning & Development
$851 mln
+4.9%
36.9%
25.6%
Outdoor & Recreation
$240 mln
+3.7%
3.8%
5.6%
The outlook boost also requires context. The normalized EPS midpoint was lifted by 17 cents. The reported refund benefit for the quarter totaled 21 cents. This creates a four-cent shortfall compared to the earlier full-year earnings guidance.
Full-year measure
Updated 2026 outlook
Previous outlook
Midpoint change
Net sales growth
1% to 2%
Flat to 2%
+0.5 point
Core sales growth
Flat to 1%
-1% to 1%
+0.5 point
Normalized operating margin
10.0% to 10.4%
8.6% to 9.2%
+1.3 points
Normalized earnings per share
$0.73 to $0.77
$0.56 to $0.60
+$0.17
Operating cash flow
About $400 mln
$350 mln to $400 mln
+$25 mln at midpoint
Newell refers to its forward-looking non-GAAP numbers as preliminary estimates.
Peterson stated that inflation for 2026 is currently projected at $200 million, which is double Newell’s original estimate. The refunds are enabling management to hold off on implementing widespread price hikes.
Accounting profit remains ahead of cash generation. Operating cash flow stood at negative $204 million as of June. Tariff recovery funds had not been received by the end of the quarter.
Risks persist. Newell reported $5.0 billion in debt alongside $209 million in cash. The forecast for $400 million in cash flow is based on the expectation that the majority of refunds will be received prior to year-end. A decline in demand or additional cost inflation could reintroduce pressure on margins.
Third-quarter performance will indicate the sustainability of the sales rebound. Newell projects net and core sales to rise by 2%–3%. The company anticipates normalized EPS in the $0.18–$0.20 range. The non-GAAP forecast remains tentative.
TS2 TECH • EXTENDED COVERAGE
Further analysis
Editorial insight
What is driving Newell Brands shares higher following the latest earnings release?
Newell's second-quarter revenue came in at $1.99 billion, a 3.0% increase from the prior year. Adjusted EPS stood at $0.42, more than twice the analyst forecast of $0.19. Shares were up 24.7% at $6.41 as of 9:58 a.m. ET after hitting $7.105 earlier in the day. The stock surged on stronger-than-expected earnings and a significant upgrade to full-year guidance. Newell Brands
Is Newell’s turnaround now delivering sustained and widespread sales gains?
Net sales for the second quarter climbed 3.0%, marking the first growth after more than four years. Core sales, which exclude currency and portfolio impacts, grew 2.3%. Year-over-year core sales rose in five out of six business units. Seven of the company’s ten top-selling brands reported higher net sales. The broad-based gains are positive, but one quarter's results are not enough to confirm a sustained trend. Newell Brands
What are the implications of management’s increased full-year 2026 outlook?
Newell lifted its 2026 net sales growth outlook to a range of 1% to 2%. Core sales are now projected to be flat or grow up to 1% year-over-year. The company's guidance for normalized operating margins jumped to 10.0%–10.4% for 2026. The forecast for normalized EPS has increased to $0.73–$0.77, up from $0.56–$0.60. Management anticipates operating cash flow of about $400 million. Newell Brands
What proportion of the earnings outperformance was attributable to tariff recoveries?
Normalized EPS for the second quarter reflected an estimated $0.21 contribution from tariff recoveries. Of this, approximately $0.17 related to 2025 costs, with the remaining $0.04 tied to first-quarter 2026 expenses. Excluding these recoveries, normalized EPS stood at roughly $0.21 for the period, surpassing management’s previous forecast of $0.16–$0.19. The earnings attributed to recoveries are not expected to recur as operating results. Newell Brands
Will Newell be able to maintain improved margins once tariff refunds diminish?
Normalized operating margin increased to 16.2%, up from 10.7% in the same period last year. Tariff recoveries contributed about $126 million to pretax gross profit. Productivity gains and stronger revenue also offset higher costs in commodities and transportation. Management forecasts a lower full-year margin of 10.0%–10.4%. With 2026 inflation now anticipated near $200 million, execution remains critical. Newell Brands
Is Newell’s significant debt burden still a risk for the investment thesis?
Debt at the end of the quarter was steady at $5.0 billion, with cash reserves only $209 million. Net leverage dropped to 4.8 times, down from 5.5 times a year ago. Operating cash flow in the first half remained negative $204 million but showed a $67 million improvement. The company secured a new $800 million revolver, prolonging general maturity to 2031. Management expects to bring leverage comfortably below 4.5 times by the end of 2026. Nevertheless, additional tariff-refund collections rely on an unresolved government process. Newell Brands
What business segments are currently leading the rebound in Newell’s sales?
Learning & Development posted the strongest figures, achieving 4.9% core growth and $851 million in revenue. Outdoor & Recreation reported 3.7% growth in core sales and revenue of $240 million. Home & Commercial Solutions recorded $903 million in revenue, though core sales dipped 0.4%. Kitchen and Home Fragrance businesses expanded, while the Commercial segment stayed negative. Signs of recovery are spreading across segments, but some operations have yet to rebound. Newell Brands
Does Newell Brands stock remain undervalued following today’s strong rally?
With shares trading at $6.41, Newell's equity market capitalization stands at nearly $2.7 billion. Headline guidance estimates place the stock at approximately 8.3–8.8 times projected normalized 2026 earnings. Excluding the $0.17 nonrecurring recovery, the multiples increase to around 10.7–11.4 times. While these valuations seem restrained, discounts are justified by leverage and execution risks. The investment thesis mainly relies on the sustainability of 2027 earnings. Newell Brands
What do existing Wall Street price targets and ratings indicate?
The current aggregated consensus is Hold, reflecting ratings from nine analysts. The mean price target stands at $5.38, with projections spanning from $3 to $9. This average is lower than the most recent share price of $6.41. With today’s results now out, the consensus could already be outdated. The notably broad target range highlights continued uncertainty over Newell’s turnaround. MarketBeat
Which factors should investors monitor most carefully throughout the third quarter?
Guidance for the third quarter indicates net and core sales are projected to rise by 2%–3%. Normalized EPS is anticipated at $0.18–$0.20, with margins expected in the 9.5% to 10.2% range. Key challenges include enhancing Commercial performance, achieving distribution growth, and recovering refunds. Tariff impacts could reach approximately $127 million for full-year 2026. The company must maintain progress in cash conversion and further reduce leverage. Newell Brands
Roman Perkowski is a senior markets reporter at TS2.tech, specializing in stocks, technology and macroeconomic trends. A graduate of the Cracow University of Economics, he previously worked in investment research and corporate finance. His coverage helps readers understand the key forces driving global financial markets and emerging industries. Follow Roman Perkowski on Google News.