NEW YORK, August 2, 2026, 13:16 EDT
- SoFi ended Friday at $16.31, marking a 0.9% decline over the week. Meanwhile, the Nasdaq advanced 1.6%.
- Quarterly revenue and earnings, after adjustments, surpassed Wall Street expectations. Loan originations hit an all-time high of $14.8 billion.
- Management increased revenue guidance but maintained EPS at $0.60. The previous tax assumption would have resulted in $0.65.
SoFi maintained its profit forecast despite posting a record quarter last week. U.S. markets were shut on Sunday. Shares ended Friday at $16.31, marking a 0.9% weekly decline. The stock hit a 52-week low of $14.88 on Wednesday.
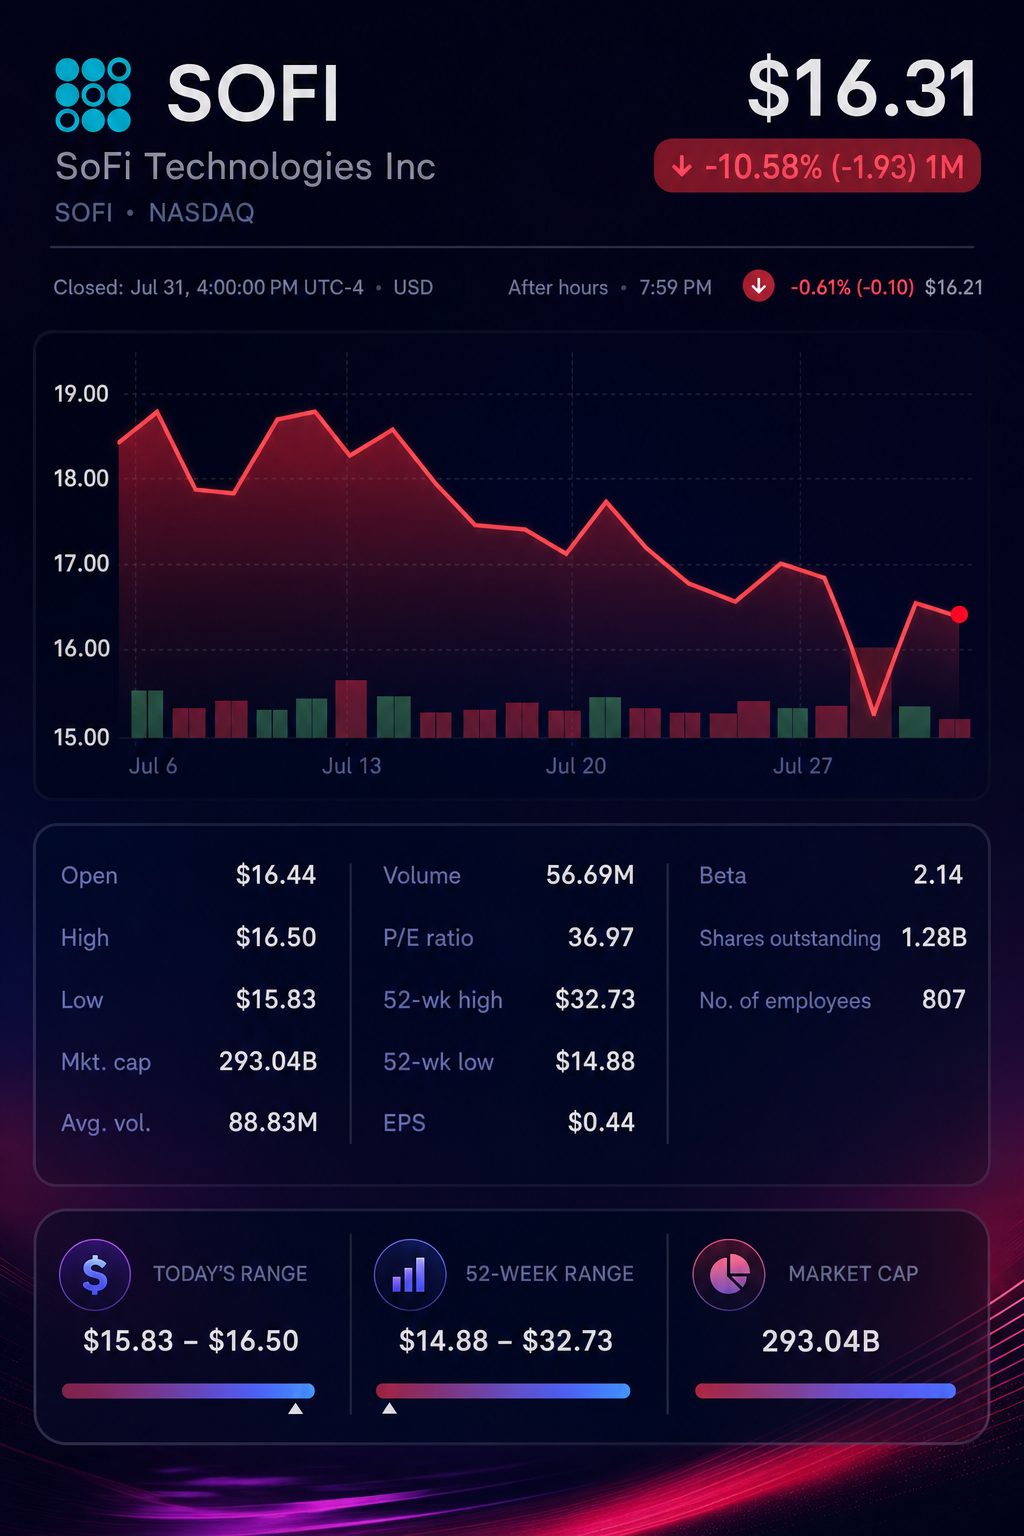
The market reaction was clear. Volume is not in question. Investors are seeking quicker translation of revenue growth into profit. Shares dropped 8.9% on Wednesday before recovering 8% on Thursday.
Adjusted revenue and EPS for the quarter came in above Wall Street forecasts. Operating gains were posted across the board.
| Q2 metric | 2026 | 2025 | Change | LSEG estimate |
|---|---|---|---|---|
| Adjusted net revenue | $1.206 billion | $858.2 million | up 40% | $1.12 billion |
| Adjusted EPS | $0.12 | $0.08 | up 50% | $0.11 |
| Adjusted EBITDA | $357.8 million | $249.1 million | up 44% | — |
| Loan originations | $14.80 billion | $8.76 billion | up 69% | — |
| Members | 15.81 million | 11.75 million | up 35% | — |
Management lifted its 2026 revenue forecast, while all key profit targets remained unchanged. The midpoint for revenue rose by $145 million, an increase of 3.1%.
| 2026 measure | April outlook | July outlook | Change |
|---|---|---|---|
| Adjusted net revenue | $4.655 billion | $4.75–$4.85 billion | Midpoint up $145 million |
| Adjusted EBITDA | About $1.60 billion | About $1.60 billion | No change |
| Adjusted net income | About $825 million | About $825 million | No change |
| Adjusted EPS | About $0.60 | About $0.60 | No change |
| Tax-rate assumption | Mid-teens | 22% | Increase of roughly 700 basis points |
| EPS at original tax rate | — | About $0.65 | 8.3% above initial guidance |
The last row provides the clearest signal to investors. Management’s revised operating forecast would have yielded an additional five cents with the initial tax estimate. However, the raised tax rate removed this gain from the issued guidance.
Management opted to focus on investing rather than boosting margins in the short term. Chief Financial Officer Chris Lapointe pointed to “too many large, attractive growth areas” to focus solely on increased profit. He said the additional revenue would be used to fund these opportunities. Q4 Stock Data
Analysts were divided on the decision. Tim Switzer of KBW described the quarter as a “lower-quality beat.” Andrew Jeffrey at William Blair saw the company’s balance-sheet expansion as a sign of increased long-term return potential. MarketWatch
The balance sheet offers a quantifiable edge. Average deposits accounted for over 90% of average liabilities in the quarter.
| Funding and revenue measure | SoFi result | Comparator | Difference or share |
|---|---|---|---|
| Interest-bearing deposit cost | 3.07% | Warehouse facilities: 4.63% | 156 basis points less |
| Annualized interest savings | $712.6 million | 2026 EBITDA guide: $1.60 billion | 44.5% |
| Fee-based revenue | $472.3 million | Total revenue: $1.219 billion | 39.0% |
| Loan-platform originations | $3.1 billion | Total originations: $14.8 billion | 20.9% |
The annualized funding benefit amounts to almost 45% of projected EBITDA, supporting outlays on marketing, product development, and increased taxation. This is a key reason why balance-sheet expansion continues to be at the core of management’s approach.
Fee-based revenue accounted for 39% of overall revenue. The third-party loan platform contributed roughly one-fifth of total originations. That segment brings in fees while allowing SoFi to avoid holding all loans on its balance sheet.
The capital-light narrative is still mixed. Revenue from the technology platform declined 23% to $84.5 million. Contribution margin slid to 14%, down from 30%. Account numbers decreased by 16% following the exit of a major client from the platform.
Chief Executive Anthony Noto told Reuters that “spending remains strong” and “demand remains strong.” Credit figures generally aligned with this view. SoFi projected personal-loan charge-offs at 3.7%, not counting late-stage delinquent-loan sales. The annualized rate was reported at 2.62%, factoring in those sales and new loans. Reuters
Shares ended Friday trading at 27.2 times projected adjusted EPS, and at 2.2 times the tangible book value reported by the company. Both figures are based on SoFi’s share price and provided guidance.
Focus turns to credit demand and jobs data in the week ahead. Both reports may influence forecasts for borrower losses or shape views on where interest rates are headed.
| Date and time, ET | Scheduled release | Relevance for SoFi |
|---|---|---|
| Monday, August 3, 2:00 p.m. | Fed bank-lending survey | Trends in credit standards, loan demand |
| Tuesday, August 4, 10:00 a.m. | June job openings | Labor market strength, borrower stability |
| Thursday, August 6, 8:30 a.m. | Q2 productivity, preliminary | Impacts on wages, rate outlook |
| Friday, August 7, 8:30 a.m. | July employment report | Income trends, risk of default |
| Friday, August 7, 3:00 p.m. | Fed consumer-credit report | Momentum in household borrowing |
Risks: Personal loans accounted for over 70% of quarterly originations. An easing labor market has the potential to increase losses. Greater competition for deposits might reduce the 156-basis-point funding advantage. Weakness in the technology platform could postpone diversification of fee income.
The upcoming challenge is conversion. SoFi has achieved increases in volume, deposits and member numbers. Now investors expect these gains to translate into stronger reported earnings.