
NEW YORK, August 4, 2026, 7:05 a.m. EDT
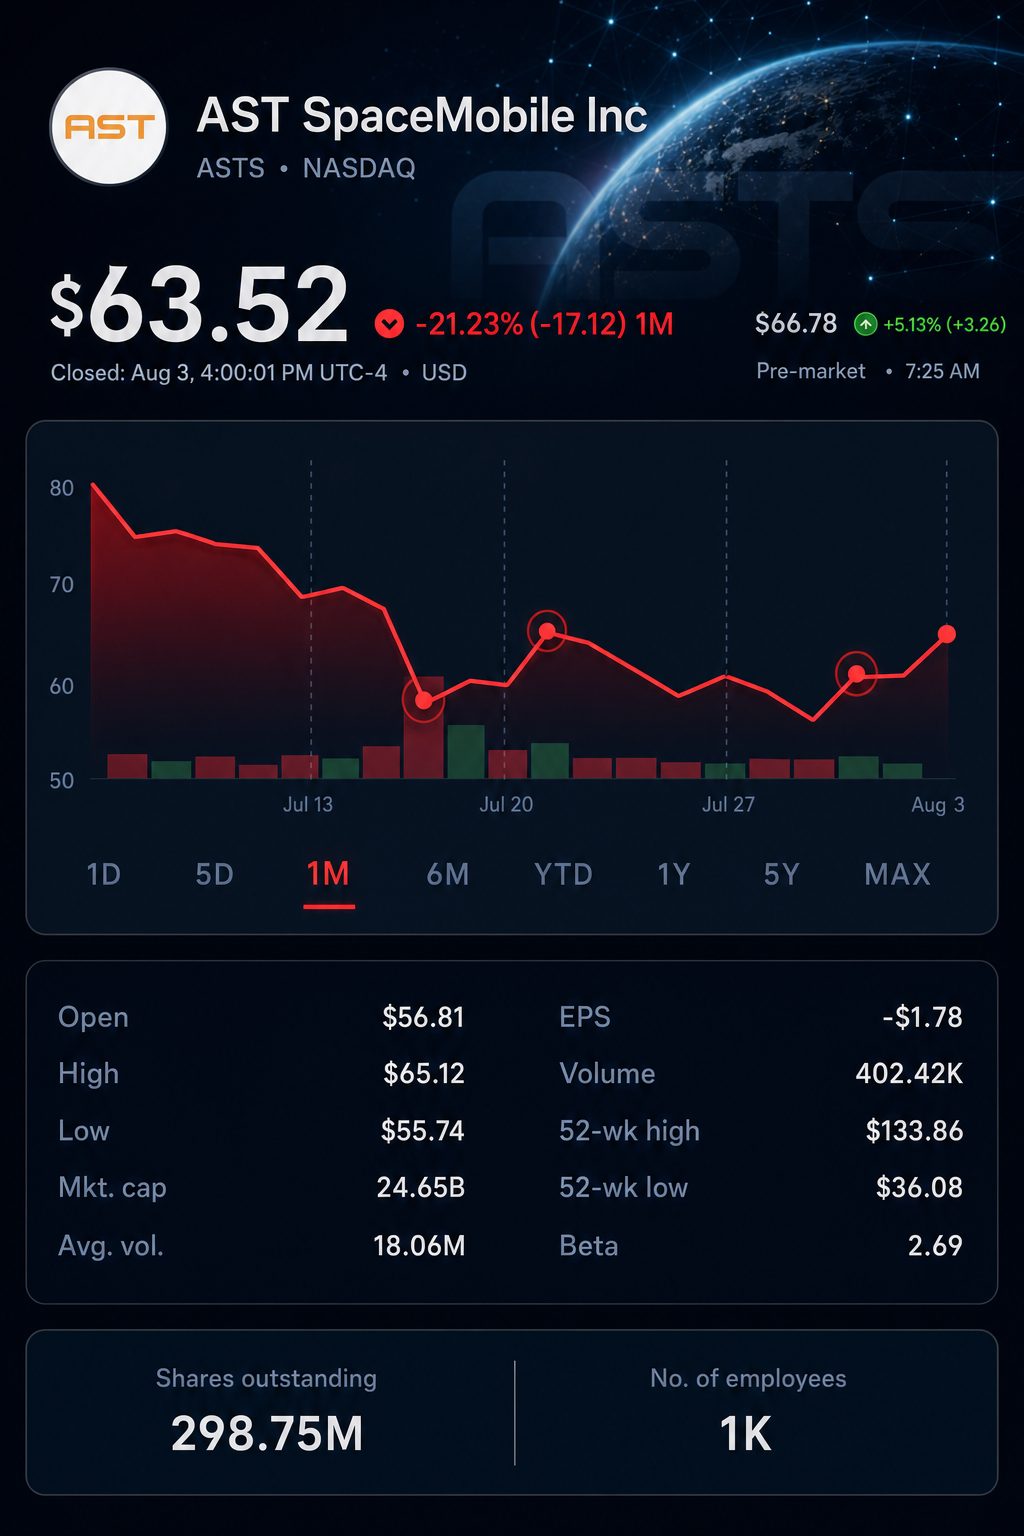
- Shares rose 4.9% in premarket trading on Tuesday, after climbing 7.7% on Monday.
- The recent note financing represents roughly 50–55 satellites, based on initial average unit cost estimates.
- Options markets are indicating a potential move of about 12% surrounding the August 10 earnings announcement.
Shares of AST SpaceMobile Inc. NASDAQ:ASTS climbed 4.9% in premarket trade on Tuesday, building on Monday’s 7.7% gain. The moves come ahead of a scheduled three-satellite launch on Wednesday. Nasdaq’s regular session was not yet underway.
A more valuable signal for investors lies beneath the price movement. The $1.15 billion note sale in July eased immediate funding stress ahead of an intensive deployment period.
The notes’ initial conversion price of $79.57 was 19.4% above premarket trading. The capped-call level of $149.20 was roughly 124% higher.
| Trading period | Starting price | Latest price | Change |
|---|---|---|---|
| Previous week, July 24–31 | $56.20 | $58.98 | +4.9% |
| Monday, August 3 | $58.98 | $63.52 | +7.7% |
| Tuesday premarket | $63.52 | $66.62 | +4.9% |
| From July 24 | $56.20 | $66.62 | +18.5% |
| Compared to 52-week high | $133.86 | $66.62 | -50.2% |
Prices are as of 6:57 a.m. EDT Tuesday. Notable moves last week included a 10.2% rise on Thursday and a 6.2% drop on Wednesday.
The terms of the financing could result in dilution significantly higher than the current market, while keeping yearly cash interest under $19 million.
| Financing measure | Transaction level | Comparison with $66.62 premarket price |
|---|---|---|
| Gross principal on notes | $1.15 billion | — |
| Coupon per year | 1.625% | Interest totals approximately $18.7 million |
| Convertible price at start | $79.57 | 19.4% above |
| Capped call upper limit | $149.20 | 124.0% above |
| Pro forma balance of cash and restricted cash | Over $3.8 billion | As of June 30 |
| Net dilution effect | Under 2% | Company projection |
Chief Financial Officer Andy Johnson described 1.625% as the firm’s “lowest coupon ever.” AST is able to settle conversions through cash, stock or a mix of both. Business Wire
The scale of the financing becomes more apparent in relation to satellite expenses. Management’s initial estimate puts the average cost of each Block 2 satellite between $21 million and $23 million.
| Capital or network benchmark | Company figure | Comparison |
|---|---|---|
| Gross notes ÷ $21 million | — | Approximately 55 satellites |
| Gross notes ÷ $23 million | — | 50 satellites |
| Noncontinuous-service threshold | 25 satellites | Five Block 1 and 20 Block 2 |
| Continuous coverage in key markets | 45–60 satellites | Company projection |
| Long-term targeted constellation | Roughly 90 satellites | Company reported baseline secured financially |
The comparison serves as an example. Funds were not dedicated only to satellites, and first-time launches may exceed the estimated average cost. AST additionally pointed to expansion initiatives and greater launch access.
Execution now plays a larger role. BlueBirds 11, 12 and 13 are planned to lift off from Cape Canaveral on Wednesday.
| Deployment milestone | Timing or status | Satellites |
|---|---|---|
| BlueBirds 8–10 | June launch completed | 3 |
| BlueBirds 11–13 | Planned for August 5 at 3:42 a.m. EDT | 3 |
| Time between missions | Roughly seven weeks | — |
| BlueBirds 14–16 | Next launch in preparation | 3 |
| Factory pipeline | Production underway through BlueBird 42 | — |
President Scott Wisniewski stated the mission “showcases our ability to rapidly and consistently build, launch, and deploy.” AST anticipates the latest satellites to reach nearly double the 98.9-Mbps peak speed achieved by the first fleet. Beta services are still planned for later this year. Business Wire
Options trading ahead of Monday’s earnings pointed to another short-term challenge. According to Bloomberg’s options data, a movement of about 12% is priced in for next week’s results.
| Earnings measure | First quarter actual | Second-quarter preliminary estimate |
|---|---|---|
| Revenue | $14.74 million | $34.54 million–$34.98 million |
| Sequential revenue change | — | Roughly +134% to +137% |
| Loss per share | $0.66 | $0.29–$0.32 |
| Options-implied stock move | — | Around 12% |
| Business-update call | — | August 10, 5 p.m. EDT |
The projected revenue would more than double from the previous quarter. However, quarterly sales are still vulnerable to gateway shipments and the timing of government milestones. AST had not booked any commercial SpaceMobile service revenue as of March.
AST trades at a higher valuation premium compared to established satellite operators. The companies differ in services offered and stages of maturity.
| Listed satellite company | August 3 close | Monday move | Market value |
|---|---|---|---|
| AST SpaceMobile Inc. NASDAQ:ASTS | $63.52 | up 7.7% | $24.65 billion |
| Globalstar Inc. NASDAQ:GSAT | $84.18 | up 1.0% | $10.84 billion |
| Iridium Communications Inc. NASDAQ:IRDM | $48.32 | up 2.1% | $5.12 billion |
AST’s market capitalisation at the close was approximately 2.3 times that of Globalstar. It stood at about 4.8 times Iridium’s, with Iridium continuing to report profits. The elevated valuation highlights the importance of launch schedule and service deployment.
Risks: The launch schedule is subject to vehicle availability, testing outcomes, and weather conditions. Delays in regulatory approvals, deployment issues, increased satellite expenses, or slower-than-expected beta rollout may undercut the argument. Adjustments to capped-call hedges could influence trading activity.
Related articles: NASDAQ:ASTS