NEW YORK, August 5, 2026, 05:08 EDT — Snap shares rose 15% after the company reported that the bulk of its second-quarter revenue growth was powered by stronger performance in its subscription business.
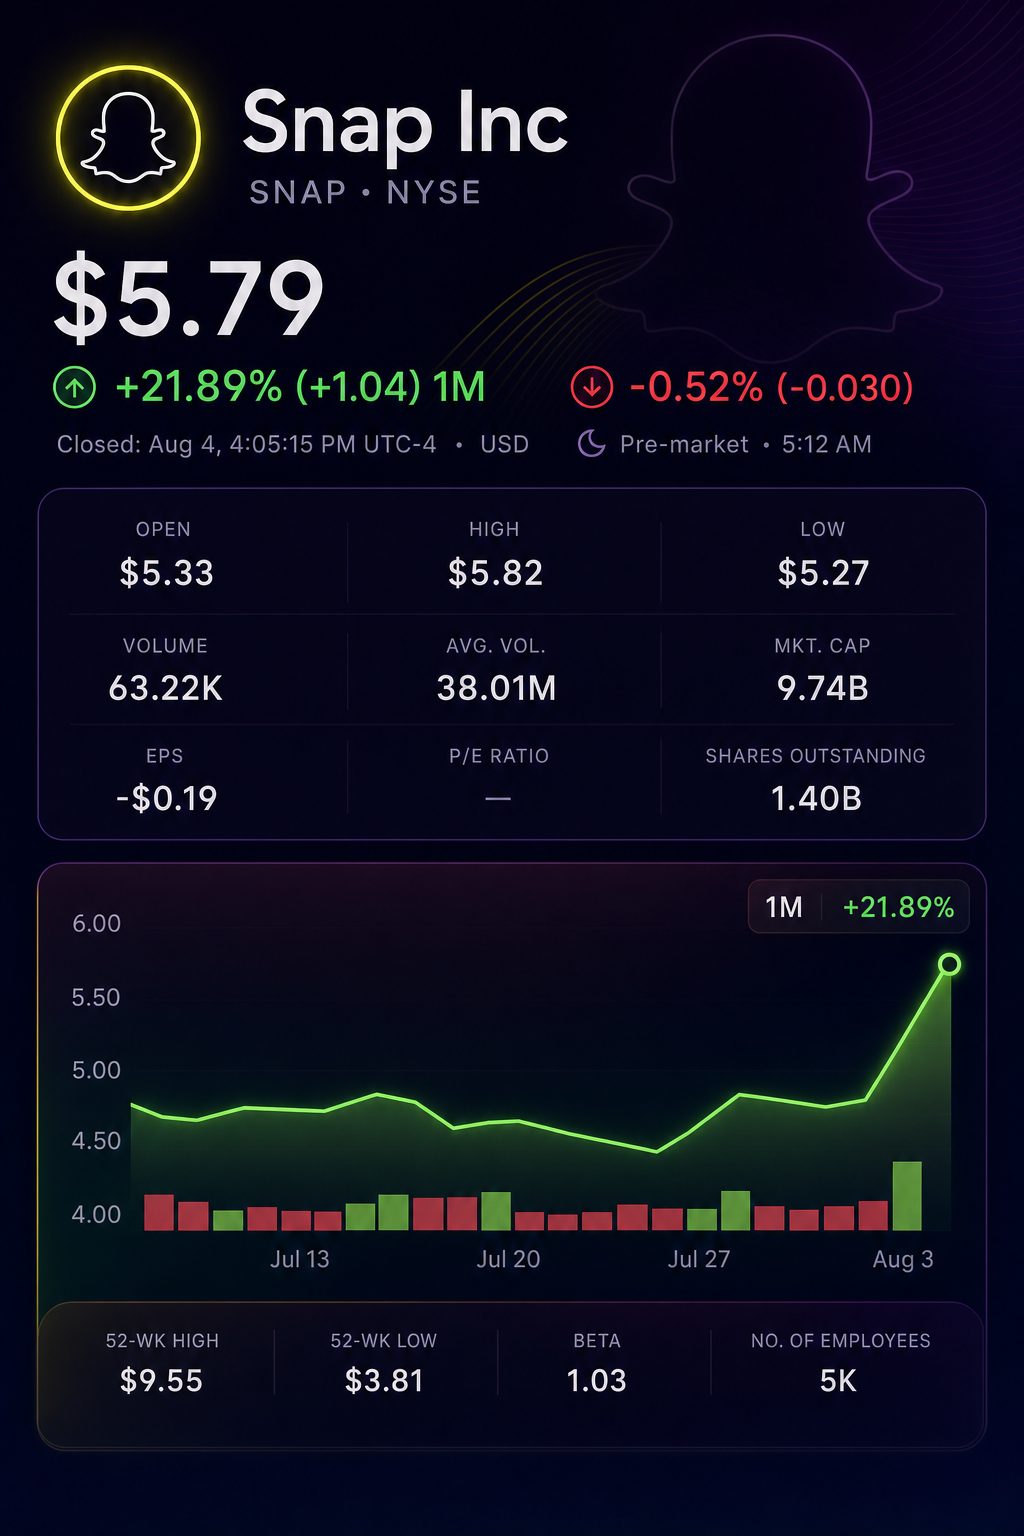
Shares in Snap Inc. NYSE:SNAP ended Tuesday up 14.9% at $5.79. Growth in other revenue, following a subscription model, accounted for 57% of the company’s second-quarter sales growth. The stock slipped 0.7% to $5.75 in after-hours premarket trade on Wednesday, with regular U.S. trading yet to commence.
The shift in revenue composition is the main takeaway for investors. Other revenue accounted for 19.8% of total sales, a rise from 12.7%. Advertising remained the largest contributor but made up just 43% of additional revenue.
Q2 revenue composition — $ millions.
| Revenue source | Q2 2026 | Q2 2025 | YoY change | Q2 2026 mix | Share of growth |
|---|---|---|---|---|---|
| Advertising | 1,282.5 | 1,173.5 | +9.3% | 80.2% | 42.9% |
| Other revenue | 316.5 | 171.4 | +84.7% | 19.8% | 57.1% |
| Total | 1,599.0 | 1,344.9 | +18.9% | 100.0% | 100.0% |
Other revenue is primarily comprised of subscriptions and partnership agreements. Sales of physical products were negligible. The rise in the quarter was driven by increased subscription income and the introduction of new paid offerings.
Chief Executive Evan Spiegel described Snap as a “multi-engine revenue business.” Less than 3% of its 971 million monthly users are paying subscribers at present. Snap has not shared a short-term conversion goal. Q4 Capital Markets
Spiegel noted that similar app subscriptions typically achieve between 7% and 12% over the long term. He clarified that this figure was intended as industry context rather than specific guidance for the company.
Advertising performance strengthened as well. Revenue climbed 9% to $1.28 billion. The average price per impression was up nearly 10%.
World Cup-related spending provided a boost. Chief Financial Officer Doug Hott noted it “wasn’t the only improvement.” He pointed to large sponsors, small business clients and automated campaign systems. Q4 Capital Markets
Worldwide daily active users increased by 5% to reach 493 million, but gains largely originated in markets with lower monetization.
Regional user economics — Figures shown are Q2 averages; company data, rounded, used for differences.
| Region | DAUs Q2 2026 | DAUs Q2 2025 | YoY change | ARPU Q2 2026 | ARPU Q2 2025 | YoY change |
|---|---|---|---|---|---|---|
| Global | 493m | 469m | +5.1% | $3.25 | $2.87 | +13% |
| North America | 92m | 98m | -6.1% | $10.26 | $8.33 | +23% |
| Europe | 98m | 100m | -2.0% | $3.62 | $2.65 | +36% |
| Rest of World | 303m | 271m | +11.8% | $1.00 | $0.96 | +4% |
North America accounted for approximately 19% of DAUs, yet generated 59% of revenue under Snap’s ARPU allocation. This discrepancy underscores the importance of retaining users in mature markets for valuation considerations.
Operating leverage jumped significantly. Adjusted expenses climbed 4%, with revenue advancing 19%. GAAP gross margin widened by seven percentage points.
Comparison of profit and cash flow.
| Metric | Q2 2026 | Q2 2025 | Change |
|---|---|---|---|
| Revenue | $1,599m | $1,345m | +19% |
| GAAP gross margin | 58% | 51% | Up 7 points |
| Adjusted EBITDA | $250m | $41m | +505% |
| Net loss | $164m | $263m | $99m less loss |
| Free cash flow | $121m | $24m | +407% |
| Common shares outstanding | 1.682bn | 1.682bn | No change |
Free cash flow over the trailing period totaled $706 million. With Tuesday’s market capitalization at $9.6 billion, this represents approximately 7.3%. This is not an earnings yield.
Share repurchases continue to be required. Snap bought back 48.6 million shares in Q2. The number of common shares was unchanged, while fully diluted shares increased by 3% to 1.881 billion.
Management anticipates stock compensation of approximately $1.05 billion for 2026. This figure is roughly 1.5 times trailing free cash flow, underscoring the issue of dilution rather than an outflow of cash.
Q3 outlook offers a mixed picture. Revenue surpasses preliminary consensus, while adjusted EBITDA falls just short.
Q3 forecast compared to initial market expectations.
| Metric | Snap guidance | Midpoint | Consensus or prior guide | Difference |
|---|---|---|---|---|
| Q3 revenue | $1.70bn–$1.74bn | $1.72bn | $1.70bn consensus | +1.2% |
| Q3 adjusted EBITDA | $300m–$350m | $325m | $329.9m consensus | -1.5% |
| 2026 infrastructure costs | $1.65bn–$1.70bn | $1.675bn | Prior: $1.60bn–$1.65bn | Increase of $50m on both ends |
Snap increased its annual infrastructure budget by $50 million at both the lower and upper ranges, with management attributing the boost to greater investment in AI and machine learning. Consensus forecasts are early and subject to revision.
Risks: User numbers in North America are still lower than the same period last year. Management anticipates World Cup expenditures will return to typical levels in Q3. Enforcement of youth-safety regulations and legal actions in the U.S. may lead to higher expenses or less engagement. Share-based payments might use up funds that could otherwise go toward share repurchases.
Tuesday’s surge benefited from a wider range of revenue streams. The challenge ahead will be maintaining subscription growth above advertising performance without greater dilution.
Related articles: NYSE:SNAP