
NEW YORK, August 5, 2026, 04:25 EDT — Trading set to begin on Nasdaq premarket.
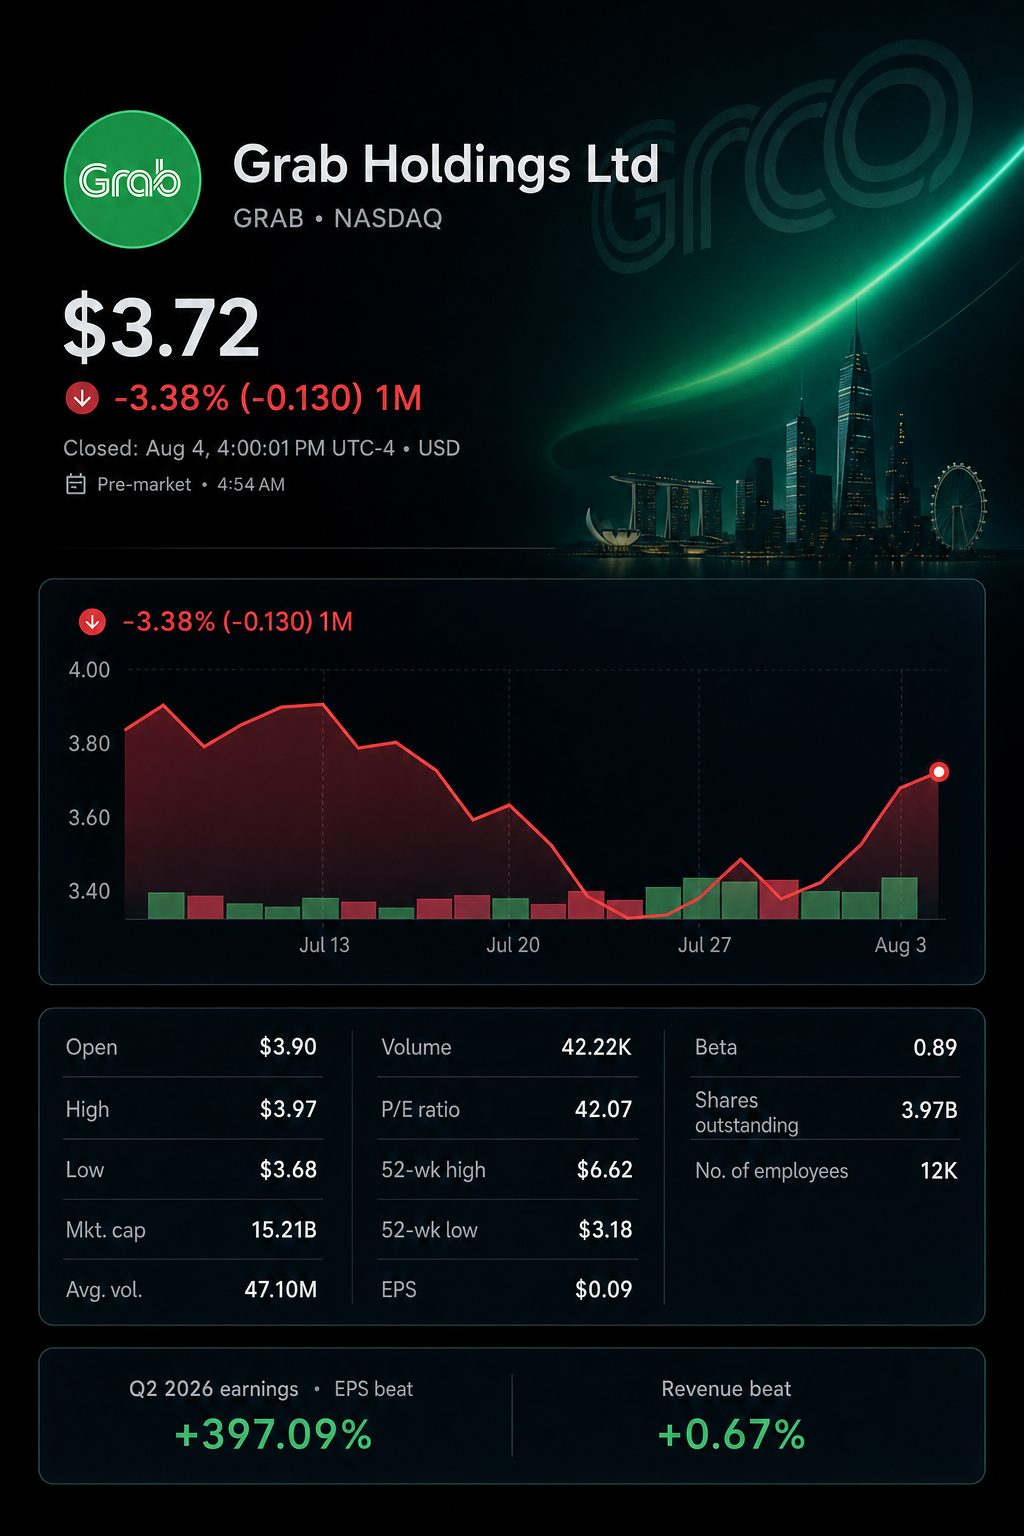
- Grab finished its previous session at $3.72, having fluctuated from $3.68 to $3.97.
- The $750 million repurchase represents approximately 5.1% of the market value.
- Adjusted EBITDA increased by 54%, while adjusted free cash flow for the quarter declined 35%.
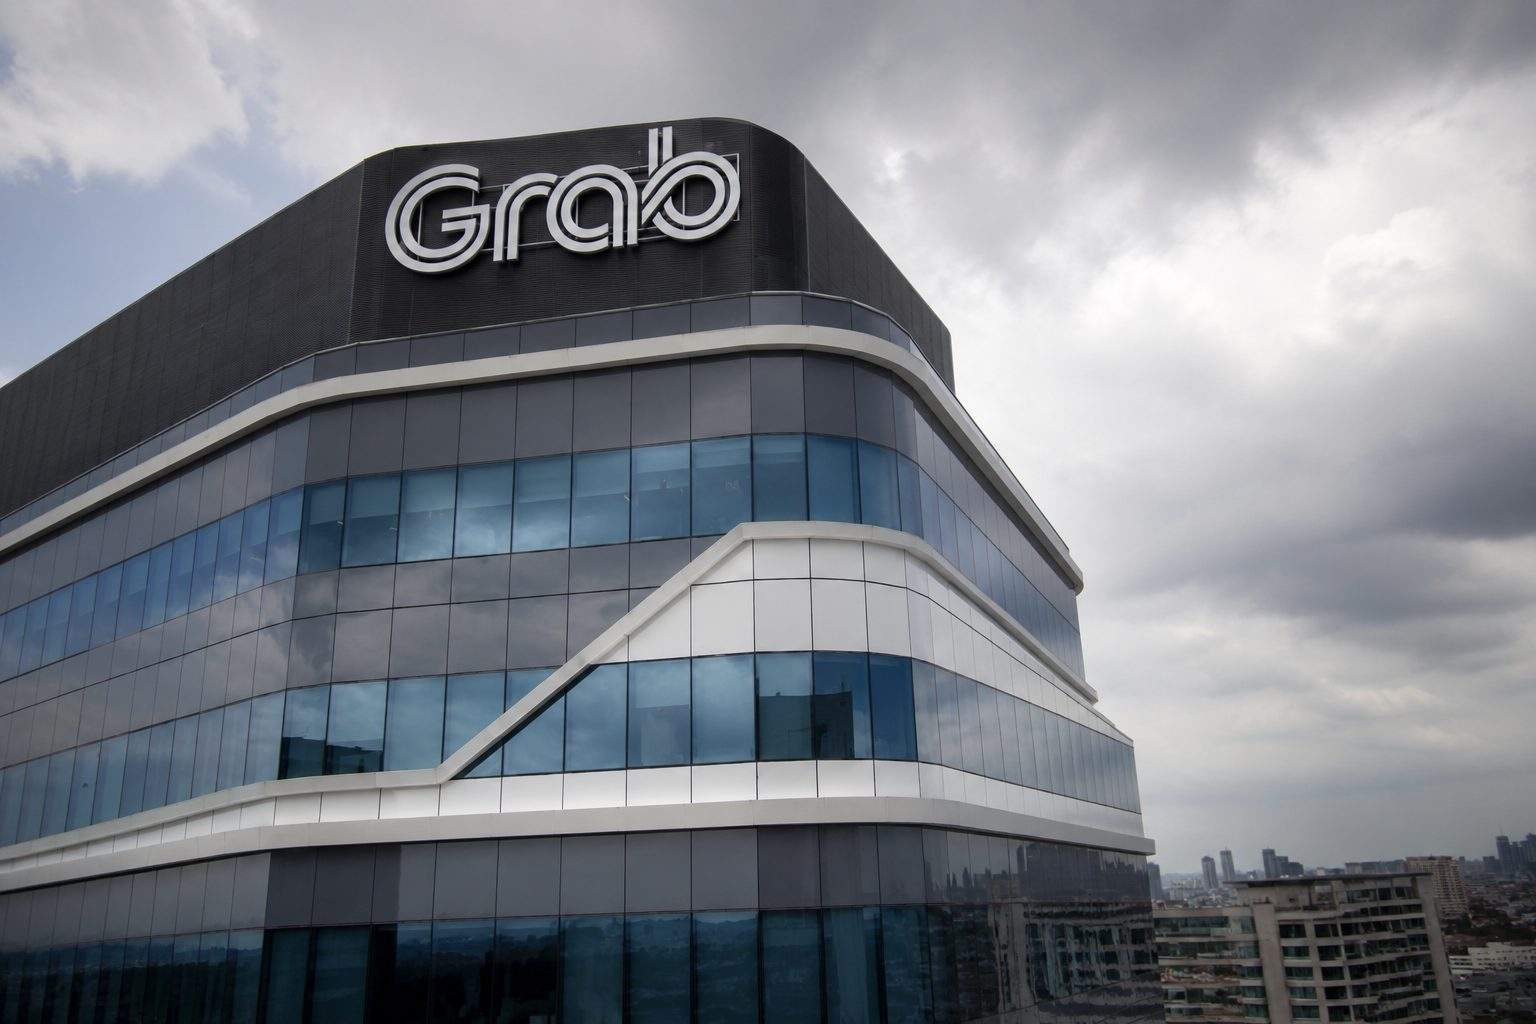
Grab Holdings Limited NASDAQ:GRAB increased its full-year outlook and approved a $750 million share repurchase after reporting second-quarter revenue of $997 million. The stock climbed 4% in after-hours trading before ending Tuesday much lower than the session peak.
The main signal for investors is the capital return. The approved amount accounts for roughly 5.1% of Grab’s $14.7 billion market capitalization. It also amounts to 13.9% of its stated net cash.
The buyback exceeds recent cash generation, representing 1.7 times the latest trailing adjusted free cash flow. Adjusted free cash flow for the quarter was $73 million. Grab is not obligated to repurchase any shares under the authorization.
Q2 2026 results — unaudited
| Metric | Q2 2026 | Q2 2025 | Change |
|---|---|---|---|
| Revenue | $997 mln | $819 mln | +22% |
| On-demand GMV | $6.463 bln | $5.354 bln | +21% |
| Monthly transacting users | 53.9 mln | 46.2 mln | +17% |
| Operating profit | $19 mln | $7 mln | +186% |
| Adjusted EBITDA | $168 mln | $109 mln | +54% |
| Operating cash flow | $56 mln | $64 mln | -12% |
| Adjusted free cash flow | $73 mln | $112 mln | -35% |
| Profit for the period | $235 mln | $20 mln | NM |
Adjusted EBITDA and adjusted free cash flow represent non-IFRS metrics.
Revenue surpassed the LSEG consensus by just 0.6%, according to Reuters data. EBITDA rose more sharply than the modest revenue beat. However, cash conversion declined.
Grab’s headline profit needs modification as well. The company booked a one-off $307 million gain from Superbank remeasurement. A deferred-tax benefit of $66 million provided additional support. However, these were partly counterbalanced by $183 million in fair-value losses.
Operating growth was led by higher volume rather than pricing. The number of monthly transacting users climbed 17%, while GMV per user went up 3%. Chief Executive Anthony Tan stated growth was attributed to “transactions and users rather than prices.” SEC
Expansion efforts demanded increased assistance. Overall incentives rose to $706 million, making up 10.9% of on-demand GMV, up by 72 basis points. Grab attributed this to higher fuel prices and the introduction of its lower-cost service options.
Section comparison
| Segment | Q2 revenue | Revenue growth | Adjusted EBITDA | EBITDA change | Operating marker |
|---|---|---|---|---|---|
| Deliveries | $531 mln | +21% | $96 mln | +53% | Margin 2.3% of GMV, increased 45 bps |
| Mobility | $331 mln | +12% | $191 mln | +16% | Margin 8.6% of GMV, slipped 9 bps |
| Financial services | $134 mln | +59% | -$15 mln | Loss reduced by 41% | Loan portfolio grew 197% |
The company’s numbers are unaudited. Grab calculates segment margins based on its own non-IFRS definitions.
Margin gains were most evident in deliveries. The mobility segment continued to lead in segment profits, though its margin decreased. Financial services recorded the highest growth, accompanied by a rise in credit exposure.
Peter Oey, CFO, told Reuters that “ASEAN customers are watching their wallet.” Grab allocated over $7 million for driver support. The count of active drivers increased by 19% while fuel expenses remained high. Reuters
Updated guidance and projected implications for the second half
| Metric | Previous FY midpoint | New FY midpoint | H1 actual | Implied H2 | H2 versus H1 |
|---|---|---|---|---|---|
| Revenue | $4.070 bln | $4.125 bln | $1.952 bln | $2.173 bln | up 11.3% |
| Adjusted EBITDA | $710 mln | $730 mln | $322 mln | $408 mln | up 26.7% |
Estimate based on rounded quarterly data and the revised guidance midpoint.
The guidance raise is limited compared to the buyback news. Revenue midpoint advanced 1.4%. Adjusted EBITDA midpoint moved up by 2.8%. However, Grab must now deliver second-half EBITDA about 27% greater than its first-half performance.
The financial services division is required to contribute to the planned improvement. Grab anticipates that the segment will report positive adjusted EBITDA in the second half. The company is also aiming for a loan portfolio exceeding $3 billion by the end of the year. Stash will be included in reported results starting from the third quarter.
Comparison of capital allocation
| Measure | Amount | Buyback relationship |
|---|---|---|
| Approved new buyback | $750 mln | — |
| Market capitalization | $14.71 bln | Equals 5.1% of buyback |
| Declared net cash | $5.40 bln | Equivalent to 13.9% of buyback |
| Trailing adjusted free cash flow | $450 mln | Buyback matches 1.7x cash flow |
| Previously completed 2026 buybacks | $351 mln | Current approval is 2.1x greater |
Grab’s available liquidity and present market capitalization have been used in the calculations.
The trading suggests that investors distinguished between operational improvements and reported accounting profits. Shares increased 4% in after-hours trading, opened at $3.90, climbed to $3.97, and ended the session at $3.72. The next key indicator will be the actual implementation of the buyback.
Risks continue to center on incentives, fuel prices, and credit exposure. In July, Indonesia implemented a revised commission scheme for ride-hailing. Integration steps and fair-value fluctuations from Superbank and Stash add complexity. This quarter, Grab updated its definition of adjusted free-cash-flow.
The immediate challenge is clear. Grab needs to quickly convert rising user numbers into sustained cash generation. Buybacks must show up in the outstanding shares. Its financial services arm has to achieve the profit turnaround it has pledged.
Related articles: NASDAQ:GRAB

![Asia Stock Market Today 27/08/2026 [UPDATE: 00:10 SGT] [Chip Losses Narrow as KASE Global Enters Final Hour]](https://ts2.tech/wp-content/uploads/2026/08/Asia-market-dashboard-2026-08-27-0010-480x384.jpg "Asia Stock Market Today 27/08/2026 [UPDATE: 00:10 SGT] [Chip Losses Narrow as KASE Global Enters Final Hour]")