
NEW YORK, August 6, 2026, 13:01 EDT — Trading kicks off in U.S. markets.
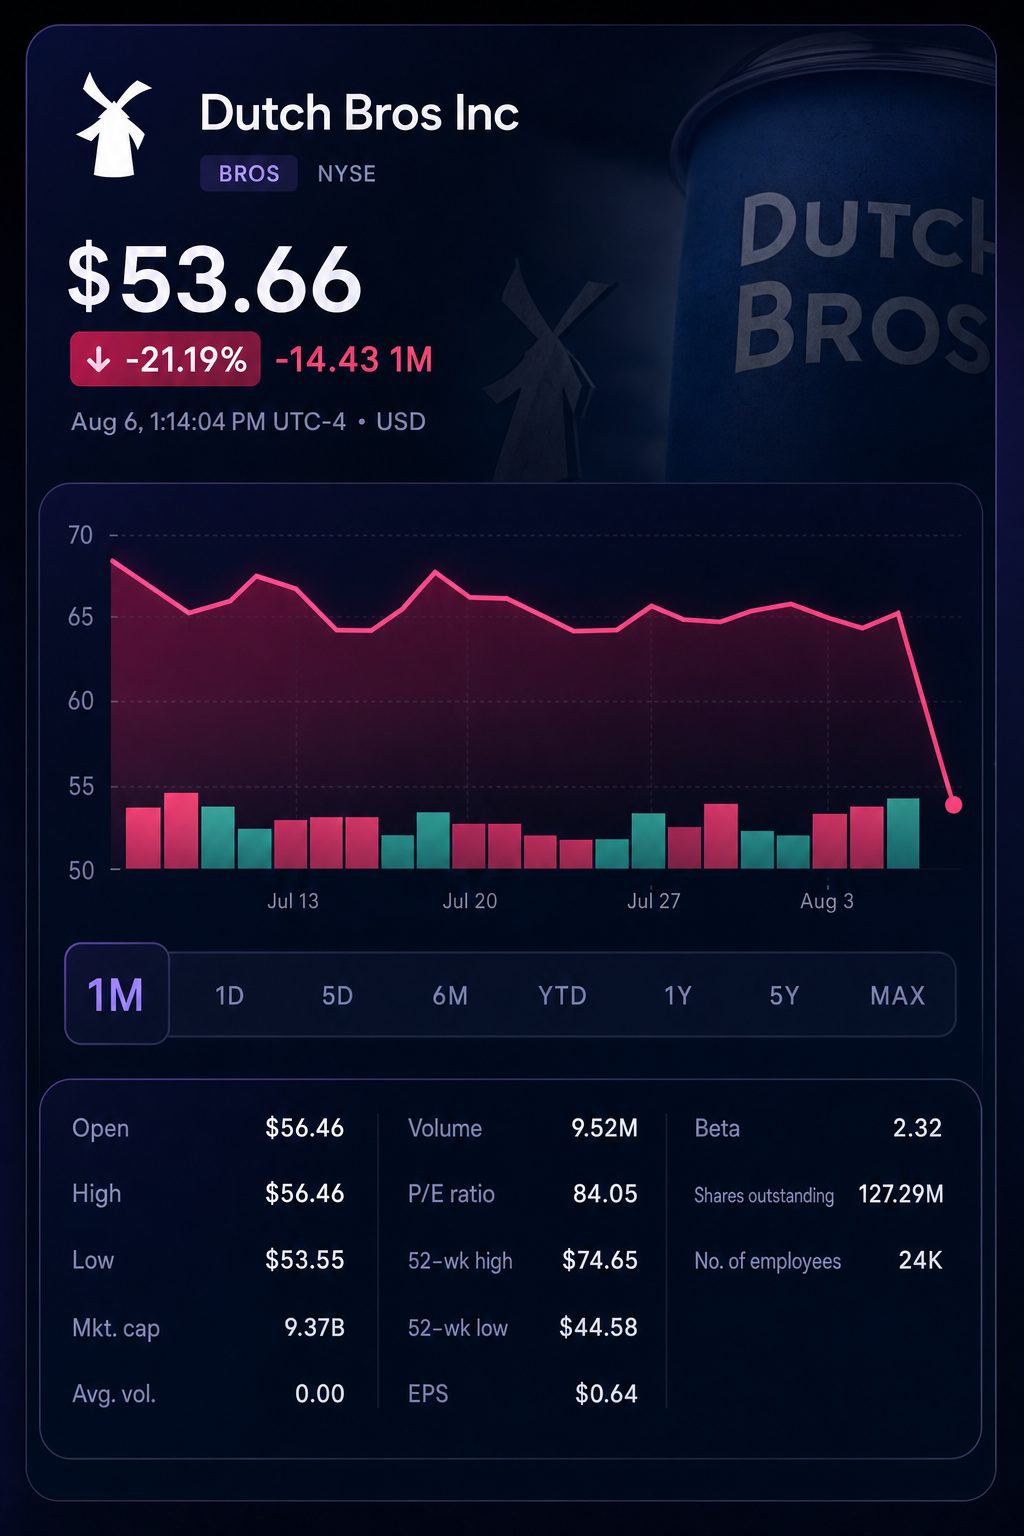
- The stock dropped 18.4% to $53.60 as of 12:58 p.m. EDT, with trading volume surpassing 9 million shares.
- Calculated estimate: Roughly fifty percent of the revenue-guidance midpoint rise can be attributed to the purchase of the Phoenix franchise.
- Systemwide transactions increased by 1.7%, marking a slowdown. Leadership projected comparable sales growth of 4% to 5% for the third quarter.
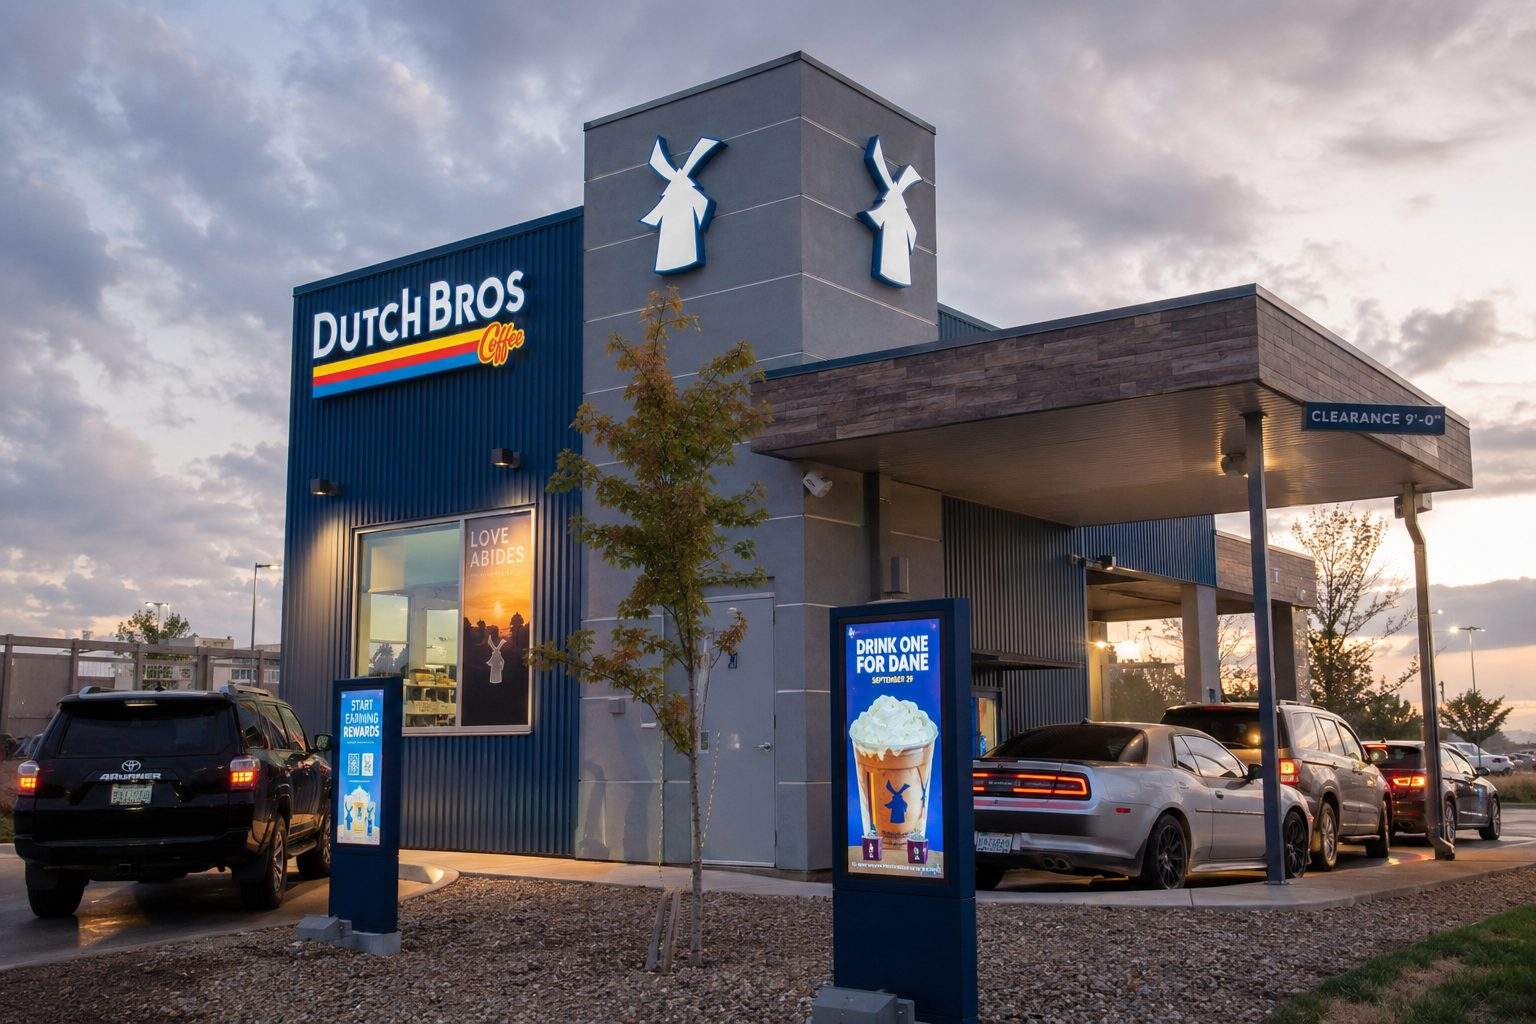
Dutch Bros Inc. NYSE:BROS shares fell 18.4% on Thursday, with the stock priced at $53.60 just before 1 p.m. EDT. Trading volume had climbed to 9 million shares, well above the daily average of 3.6 million.
Investors shrugged off a solid second-quarter earnings result. Revenue climbed 32.5%, and adjusted earnings topped the Benzinga Pro consensus. Adjusted EBITDA, however, increased at a slower pace than sales.
Q2 results overview. Figures are shown in millions of dollars, with per-share numbers as noted. Consensus data sourced from Benzinga Pro; margins derived from company disclosures.
| Metric | Q2 2026 | Consensus | Beat | Year-on-year |
|---|---|---|---|---|
| Revenue | $550.9 | $525.5 | 4.8% | 32.5% |
| Adjusted EPS | $0.33 | $0.29 | 13.8% | 26.9% |
| Adjusted EBITDA | $113.7 | — | — | 27.8% |
| Adjusted EBITDA margin | 20.6% | — | — | Lower by about 80 bps |
Based on reported revenue and adjusted EBITDA.
The key focus was the strength of the upgraded guidance. Dutch Bros lifted its full-year revenue midpoint by $50 million, while the midpoint for adjusted EBITDA climbed by $12.5 million.
Management projects that the newly acquired Phoenix franchise business will generate approximately $25 million in revenue, with an estimated $5 million increase in adjusted EBITDA for this year. The acquisition represents 50% of the revenue growth and 40% of the adjusted EBITDA growth.
Guidance comparison. Amounts are calculated as midpoints, shown in millions of dollars.
| Metric | May 6 midpoint | August 5 midpoint | Increase | Phoenix contribution | Estimated organic residual |
|---|---|---|---|---|---|
| Revenue | $2,065 | $2,115 | $50 | Roughly $25 | Roughly $25 |
| Adjusted EBITDA | $375 | $387.5 | $12.5 | Roughly $5 | Roughly $7.5 |
Initial estimate: Dutch Bros did not issue specific organic guidance. The remainder is calculated by subtracting management’s acquisition projections.
The underlying revenue boost is close to 1.2% above the earlier midpoint. Organic EBITDA is projected to climb by roughly 2%. Both metrics are positive, though less than the headline upgrade.
Capital expenditures increased at a significantly higher rate. The mid-point for guidance climbed 29% to $360 million. Chief Financial Officer Josh Guenser attributed the rise to the acquisition of Phoenix. This figure does not include the separate Salad and Go location deal.
The composition of sales further moved away from customer visits. Systemwide transactions rose by 1.7% in the second quarter, after expanding by 5.1% in the first quarter.
Breakdown of comparable sales. Ticket share figures are based on the elements reported by the company.
| Systemwide metric | Q1 2026 | Q2 2026 | Q2 2025 |
|---|---|---|---|
| Same-store sales | 8.3% | 5.8% | 6.1% |
| Transaction count | 5.1% | 1.7% | 3.7% |
| Average ticket | 3.2% | 4.1% | 2.4% |
| Ticket percentage of comp | 39% | 71% | 39% |
Ticket growth measured as a ratio to reported same-shop sales growth.
The change is significant as pricing assistance is declining. Management forecasts effective pricing to be under one percentage point for the second half. Third-quarter guidance is for systemwide comparable sales to rise between 4% and 5%.
Management pointed to challenging transaction comparisons as well as reduced pricing. Dutch Bros is also contending with the impact of last year’s food rollout. The company’s third-quarter outlook falls short of the 5.8% result achieved in the second quarter.
Growth continues to offset pressures. Dutch Bros launched 48 new shops over the quarter, 44 of which were company-operated. The chain had 1,225 shops at the end of June, an increase from 1,043 a year ago.
Systemwide annual unit volume increased approximately 6.8% to $2.193 million. Order Ahead accounted for around 16% of total transactions. According to management, these indicators provide further opportunities to bolster traffic.
Chief Executive Christine Barone reported that Dutch Bros achieved transaction growth for the eighth consecutive quarter. Guenser stated that management identified “a clear path” to convert untapped markets into sustainable growth. Business Wire
The decline exceeded losses seen in comparable companies. Starbucks Corp. NASDAQ:SBUX dropped approximately 1.1%, while Black Rock Coffee Bar Inc. (NASDAQ:BRCB) lost around 9.2%. The data indicates that Dutch Bros’ drop was predominantly linked to company-specific factors.
Sell-side analysts kept a positive outlook following the results. The recommendations below were listed on Google Finance on Thursday.
| Firm | Analyst | Recommendation | Target |
|---|---|---|---|
| Morgan Stanley | Brian Harbour | Buy, reiterated | $88 |
| Citi | Jon Tower | Buy, reiterated | $86 |
| UBS | Dennis Geiger | Buy, maintained | $85 |
| D.A. Davidson | Matt Curtis | Buy, reiterated | $85 |
| Oppenheimer | Brian Bittner | Buy, reiterated | $82 |
| Telsey Advisory | Sarang Vora | Buy, maintained | $74 |
| RBC Capital | Logan Reich | Buy, reiterated | $70 |
According to FactSet, 23 analysts issued Buy ratings and one gave an Overweight rating. One Hold recommendation was recorded, with no Sells. The median price target was $80, representing a premium of around 49% to Thursday’s midday level.
Risks: Robust productivity at new shops, increasing digital use and rising foot traffic may trigger a rebound in shares. However, rising coffee and occupancy expenses could squeeze margins. There is also execution risk linked to the Phoenix integration and plans for as many as 65 site conversions.
Currently, investors interpret the raised guidance as being driven by acquisitions. The focus now turns to organic traffic. Dutch Bros needs to maintain transaction volumes as ticket support declines.