
NEW YORK, August 6, 2026, 14:06 EDT — U.S. stocks begin trading.
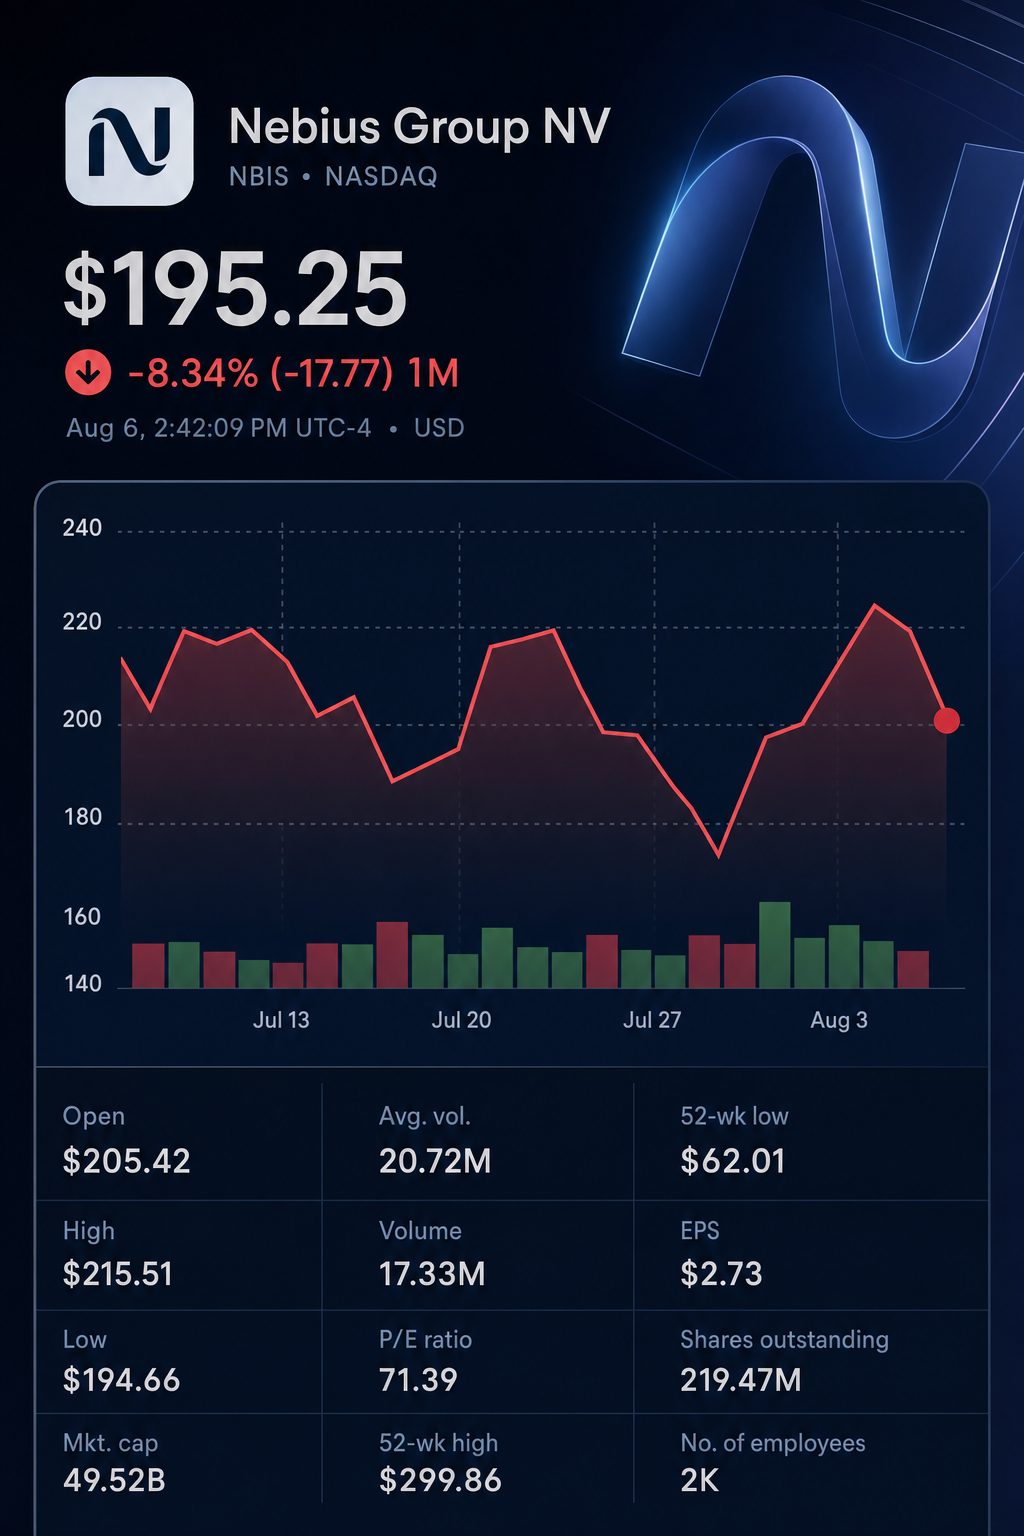
- Nebius shares declined by 9.95% to last trade at $197.21. Shares of its nearest listed rivals registered smaller declines.
- Initial consensus estimates see second-quarter revenue at $535.03 million, representing a 34.1% sequential increase.
- Nebius must generate average quarterly revenue exceeding $1 billion in the second half to achieve its 2026 targets.
Nebius Group N.V. NASDAQ:NBIS fell nearly 10% on Thursday, lagging behind other artificial-intelligence infrastructure peers on the exchange.
The drop increases the pressure on next week’s earnings report. Investors will have to assess if capacity expansion is enough to drive a significant revenue surge in the second half.
Nebius announced on Wednesday that Lindsey Irvine has been named chief marketing officer. The company did not provide updated financial guidance.
The development came after two analyst moves. Piper Sandler Companies NYSE:PIPR initiated coverage with a Neutral rating, and Citigroup Inc. NYSE:C reduced its price target but maintained its Buy recommendation.
| Listed AI-infrastructure company | Latest price | Thursday change | Performance relative to Nebius |
|---|---|---|---|
| Nebius Group N.V. NASDAQ:NBIS | $197.21 | -9.95% | — |
| CoreWeave Inc. NASDAQ:CRWV | $86.58 | -3.68% | 6.27 points |
| Applied Digital Corp. NASDAQ:APLD | $29.52 | -1.17% | 8.78 points |
| IREN Ltd. NASDAQ:IREN | $38.83 | -0.15% | 9.79 points |
Prices reflect the most recent data available at the time of publication. Relative performance numbers are based on these figures.
The decline wiped out a significant portion of this week’s earlier gains. Despite the drop, Nebius stayed around 3.6% higher than its $190.41 closing price last Friday.
The more significant evaluation for investors is the revenue bridge. Nebius posted $399 million in sales during the first quarter, with preliminary consensus forecasting $535.03 million in second-quarter revenue.
| Revenue benchmark | Amount | Required change |
|---|---|---|
| First-quarter 2026 reported | $399.00 million | — |
| Initial second-quarter average estimate | $535.03 million | +34.1% over prior quarter |
| Second-half quarterly average needed to meet $3.0 billion full-year revenue | $1.033 billion | +93.1% from Q2 consensus |
| Second-half quarterly average required for $3.4 billion annual revenue | $1.233 billion | +130.5% compared to Q2 consensus |
Preliminary second-half figures are based on actual first-quarter revenue, second-quarter revenue consensus, and the company’s unchanged $3.0 billion to $3.4 billion guidance for 2026.
This means Nebius needs to deliver around 1.9 to 2.3 times its projected second-quarter revenue in every subsequent quarter.
Timing for capacity is key. According to management, expansions in the third quarter are expected to greatly increase its presence, backing the goal of reaching 800 megawatts to one gigawatt of connected power before the end of the year.
| First-quarter operating measure | 2025 | 2026 | Change |
|---|---|---|---|
| Revenue | $50.9 million | $399.0 million | Rose 684% |
| Adjusted EBITDA | -$53.7 million | $129.5 million | Shifted to positive |
| Cost of revenue as percentage of sales | 49% | 26% | Dropped by 23 points |
| Purchases of property, equipment and intangible assets | $543.9 million | $2.473 billion | Up 355% |
Figures released by the company.
First-quarter results highlighted solid operating leverage, while also revealing the capital-intensive nature of Nebius’s growth.
Investment spending totaled nearly $2.5 billion in the quarter. Cash was $9.30 billion as of March 31, with total debt close to $8.45 billion.
Nebius has worked to lessen that load. In July, it secured $775 million in financing backed by GPUs and cash flow contracts, and projects funded by partners need less upfront capital.
| Analyst or consensus source | Latest stance | Price target | Upside from $197.21 |
|---|---|---|---|
| FactSet Research Systems Inc. NYSE:FDS consensus | Overweight | $267.31 average | 35.5% |
| Piper Sandler Companies NYSE:PIPR, August 4 | Neutral | $224 | 13.6% |
| Citigroup Inc. NYSE:C, August 5 | Buy | $278 | 41.0% |
| Bank of America Corp. NYSE:BAC, June 8 | Buy | $280 | 42.0% |
| D.A. Davidson, May 18 | Neutral | $250 | 26.8% |
| Northland Securities, July 20 | Outperform | $410 | 107.9% |
Upside is calculated based on the most recent Nebius price from Thursday. According to FactSet, there are 11 Buy, one Overweight, six Hold, and one Sell ratings.
The target range is notably broad, spanning from $144 up to $410, due to significantly varied expectations regarding capacity delivery and anticipated future margins.
James Fish, an analyst at Piper, pointed to Nebius’s asset-light approach and reliance on customer prepayments. He also noted short-term risks to estimates, especially concerning the Vineland data center.
Marc Boroditsky, Chief Revenue Officer, stated “sustaining that growth requires more than a brand story” during Irvine’s announcement. The same challenge now extends to driving capacity and revenue. Nebius
There are still significant risks related to construction schedules, GPU supply and financing requirements. High reliance on key customers, pricing challenges and a slowdown in AI demand may also reduce returns on newly added capacity.
Nebius is set to announce its second-quarter earnings ahead of the market open on August 12. While revenue will be closely watched, the timeline for third-quarter capacity could draw even more attention.
Related articles: NASDAQ:NBIS