
NEW YORK, August 6, 2026, 16:07 EDT — The U.S. cash equity markets have ended the session.
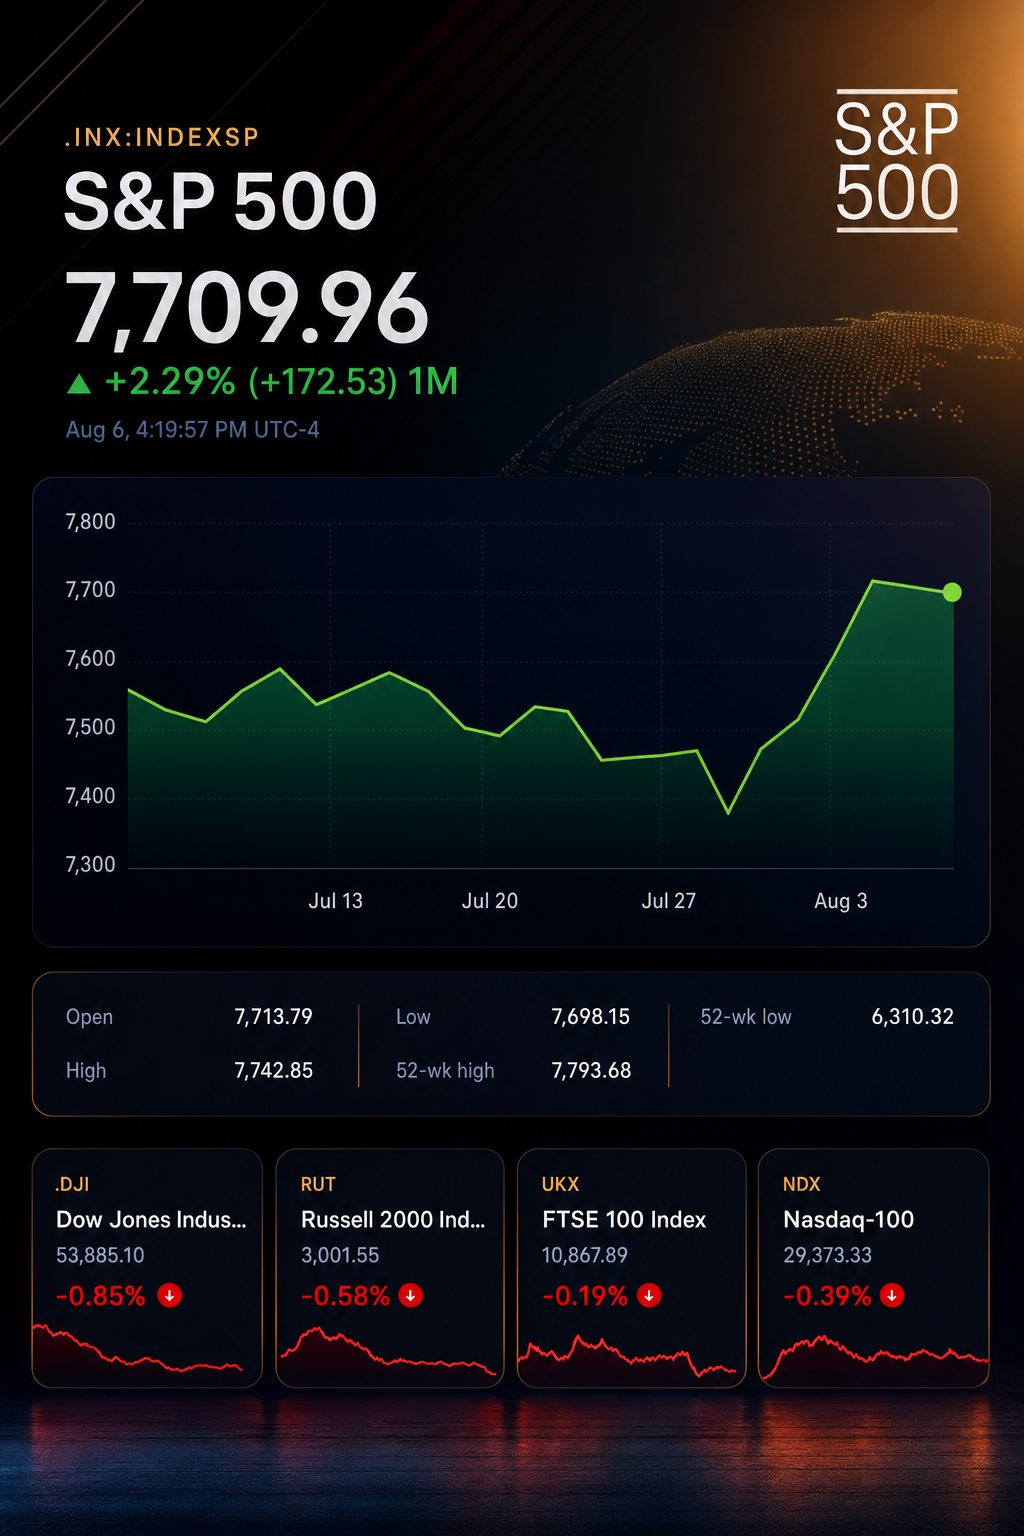
- The S&P 500 edged down 0.07%, while the Nasdaq rose 0.04%. The Dow dropped 0.71%.
- Approximately 59% of NYSE listings declined, even as indexes remained close to record highs.
- Friday’s jobs data comes ahead of the CPI and PPI reports due next week.
U.S. equities closed Thursday flat overall, though underlying market action was more negative. Declining stocks accounted for about 59% of NYSE listings and 57% of those on the Nasdaq. Four leading technology stocks reporting earnings dropped an average of 12.5%.
The split is significant as corporate earnings remain robust. Roughly 85% of S&P 500 firms have released results. Profits are rising at the fastest rate since 2021. Despite this, stocks that missed guidance faced sharp selloffs.
Thursday’s lull did little to slow down a robust opening to August. The S&P 500 is still up 3.05% since the close on July 31. The Nasdaq has advanced 3.95%, and the Dow has risen 2.81%.
| Index | August 6 close | Thursday | Since July 31 | Previous week |
|---|---|---|---|---|
| S&P 500 | 7,718.05 | down 0.07% | up 3.05% | up 1.05% |
| Dow Jones Industrial Average | 53,961.45 | down 0.71% | up 2.81% | around up 1.0% |
| Nasdaq Composite | 26,374.92 | up 0.04% | up 3.95% | up 1.59% |
Returns since July 31 are based on the referenced closing levels.
The index gains failed to lift the majority of stocks. On the NYSE, declining stocks outnumbered advancers by a ratio of 1.46-to-1. The Nasdaq saw decliners lead advancers by 1.35-to-1. While new-high figures stayed in positive territory, the margin was much slimmer on the Nasdaq.
| Market breadth indicator | NYSE | Nasdaq | S&P 500 |
|---|---|---|---|
| Number of decliners for each advancer | 1.46 | 1.35 | — |
| Estimated percentage of issues declining | 59.3% | 57.4% | — |
| Count of 52-week highs | — | 119 | 29 |
| Count of 52-week lows | — | 63 | 4 |
| Ratio of new highs to new lows | — | 1.9 | 7.3 |
Calculated based on the published advance-to-decline ratios.
Companies showing robust growth yet uncertain future outlooks saw the steepest declines. Investors viewed positive results as falling short.
| Company | Closing move | Latest reported data | What investors rejected |
|---|---|---|---|
| AppLovin NASDAQ:APP | Fell over 18% | Revenue increased 53% to $1.924 billion | Revenue came in below Wall Street forecast |
| Datadog NASDAQ:DDOG | Slipped around 17% | Revenue climbed 36% to $1.12 billion | Full-year sales outlook of $4.45 billion to $4.47 billion fell short of analysts’ $4.69 billion expectations |
| Western Digital NASDAQ:WDC | Dropped almost 11% | Revenue jumped 44% to $3.75 billion; adjusted EPS was $3.56 | Guidance surpassed consensus but failed to meet higher market hopes |
| Sandisk NASDAQ:SNDK | Lost more than 4% | Preliminary: Quarterly revenue surged 51% quarter-on-quarter to $8.97 billion | Outlook topped consensus but was not enough to maintain momentum |
The average of the four closing moves came to minus 12.5%. That was Thursday’s most distinct message from investors. Robust present earnings could not shield stocks from weaker forward guidance.
Datadog CEO Olivier Pomel said clients were “building and deploying with AI.” Revenue increased by 36%, with continued strength in large-customer expansion. However, investors reacted to a slowdown in third-quarter growth and reduced full-year guidance. Datadog
Divya Mathur, portfolio manager at ClearBridge Investments, noted that prices can “react more sharply than the underlying outlook.” Her observation reflected the recent storage sector decline. Shares of Western Digital and Sandisk had previously surged well ahead of the broader market. Reuters
Analyst moves on Thursday reflected a similar reset, with each action listed below representing a downgrade that followed recent company announcements.
| Company | Brokerage | Recommendation change | New target |
|---|---|---|---|
| AppLovin NASDAQ:APP | Wells Fargo NYSE:WFC | Overweight cut to Equal Weight | $357 |
| AppLovin | Piper Sandler NYSE:PIPR | Overweight lowered to Neutral | $385 |
| Western Digital NASDAQ:WDC | Summit Insights | Buy reduced to Hold | Not given |
| HubSpot NYSE:HUBS | Stifel Financial NYSE:SF | Buy changed to Hold | $200 |
| HubSpot | Capital One Financial NYSE:COF | Overweight shifted to Equal Weight | $206 |
Initial government figures provided a contrasting signal. Productivity increased at a 1.4% annual rate in the second quarter, ahead of the 0.6% prediction. Unit labor costs climbed 1.3%, less than the 2.1% anticipated. Together, these figures are favorable for corporate margins.
Oil prices headed higher. U.S. crude climbed 2.75% to $77.29, and Brent advanced 3.65% to $82.35. The yield on 10-year Treasuries approached 4.67%. Robert Bernstone of SummitTX Capital pointed to “headline fatigue” regarding Iran. Reuters
The July payroll data will be published Friday at 8:30 a.m. EDT. Economists polled by Reuters forecast 80,000 jobs added and an unemployment rate of 4.2%. July CPI figures follow on Wednesday, with PPI released Thursday, both at 8:30 a.m. EDT.
Risks: An unexpectedly strong payroll reading may push yields higher and weigh on pricey growth stocks. Conversely, a soft release has the potential to stoke concerns over economic growth. Additional spikes in oil prices would further constrain financial conditions. If earnings guidance is reduced further, Thursday’s focussed earnings-driven selloff could spread.
Related articles: NASDAQ:APP